Frequently asked questions
What’s the background behind the C4 model?
The C4 model was created by Simon Brown, who started teaching software architecture, while working as a software developer/architect. Part of Simon’s training course was a design exercise, where groups of people were given some requirements, asked to do some design, and to draw some diagrams to express that design.
Although this was a design focussed exercise, the wide variety of diagrams made it evident that the visualisation of ideas was a skill that most people sorely lacked. The C4 model is essentially a formalisation of how Simon used to visualise software architecture, which has evolved over the years.
Exact dates are hard to pin down, but the roots of the C4 model can be traced back to somewhere in the region of 2006-2009, the diagram types (“context”, “containers”, “components”, “classes”) were named in early 2010, with the “C4” name being first used in early 2011. The fourth diagram type was renamed from “classes” to “code” during 2015-2016.
What’s the inspiration behind the C4 model?
The C4 model was created during a time where teams, influenced by the agile movement, were less than enthusiastic about using the Unified Modeling Language (UML) to document software architecture, if they were creating diagrams at all. Despite this, the C4 model was inspired by UML and the 4+1 model for software architecture. In summary, you can think of the C4 model as a simplified version of the underlying concepts, designed to (1) make it easier for software developers to describe and understand how a software system works and (2) to minimise the gap between the software architecture model/description and the source code.
Who is using C4?
Simon has personally taught the C4 model to 10,000+ people in ~40 countries; with conference talks, videos, books, and articles reaching many more than this. Other people are also teaching, speaking, and writing about the C4 model, plus it’s been integrated into a number of tools. Here are some case studies:
- Spotify: Spotify Engineering: Software Visualization - Challenge, Accepted
- Decathlon: Navigating Software Architecture at Scale: Insights from Decathlon’s Architecture Process
- Co-op: LinkedIn post
And here are some other resources that reference the C4 model:
- Wikipedia
- InfoQ: The C4 model for software architecture
- InfoQ: O modelo C4 de documentação para Arquitetura de Software
- InfoQ: 用于软件架构的C4模型
- InfoQ: ソフトウェアアーキテクチャのためのC4モデル
- Open Agile Architecture™, a Standard of The Open Group
- Agile Architecture Modeling using the ArchiMate® Language
- Martin Fowler: Building Infrastructure Platforms - Communicate your technical vision (Poppy Rowse and Chris Shepherd)
Isn’t the C4 model a step backwards? Why are you reinventing UML? Why not just use UML?
Whether you see the C4 model as a step forwards or a step backwards depends upon where you are. If you’re using UML (or SysML, ArchiMate, etc) and it’s working for you, stick with it. Unfortunately, UML usage seems to be in decline, and many teams have reverted to using ad hoc boxes and lines diagrams once again. Given that many of those teams don’t want to use UML (for various reasons), the C4 model helps introduce some structure and discipline into the way software architecture is communicated. For many teams, the C4 model is sufficient. And for others, perhaps it’s a stepping stone to UML.
The C4 model vs UML, ArchiMate and SysML?
Although existing notations such as UML, ArchiMate and SysML already exist, many software development teams don’t seem to use them. Often this is because teams don’t know these notations well enough, perceive them to be too complicated, think they are not compatible with agile approaches or don’t have the required tooling.
If you are already successfully using one of these notations to communicate software architecture, and it’s working, stick with it. If not, try the C4 model. And don’t be afraid to supplement the C4 diagrams with UML state diagrams, timing diagrams, etc if you need to.
Why doesn’t the C4 model cover business processes, workflows, state machines, domain models, data models, etc?
The focus of the C4 model is the static structures that make up a software system, at different levels of abstraction. If you need to describe other aspects, feel free to supplement the C4 diagrams with UML diagrams, BPML diagrams, ArchiMate diagrams, entity relationship diagrams, etc.
Can we combine C4 and arc42?
Yes, many teams do, and the C4 model is compatible with the arc42 documentation template as follows.
- Context and Scope => System Context diagram
- Building Block View (level 1) => Container diagram
- Building Block View (level 2) => Component diagram
- Building Block View (level 3) => Code (e.g. class) diagram
Does the C4 model imply a design process or team structure?
A common misconception is that a team’s design process should follow the levels in the C4 model hierarchy, perhaps with different people on the team being responsible for different levels of diagrams. For example, a business analyst creates the system context diagram, the architect creates the container diagram, while the developers look after the remaining levels of detail.
Although you can certainly use the C4 model in this way, this is not the intended or recommended usage pattern. The C4 model is just a way to describe a software system, from different levels of abstraction, and it implies nothing about the process of delivering software.
Using C4 to describe libraries, frameworks and SDKs?
The C4 model is really designed to model a software system, at various levels of abstraction. To document a library, framework or SDK, you might be better off using something like UML. Alternatively, you could use the C4 model to describe a usage example of your framework, library or SDK; perhaps using colour coding to signify which parts of the software system are bespoke vs those provided for you.
Is the C4 model universally applicable?
The C4 model was designed to help describe, document, and diagram custom-built, bespoke software systems. From this perspective, the C4 model can be used to describe a variety of software architectures (monolithic or distributed), built in a variety of programming languages, deployed on a variety of platforms (on-premises or cloud).
Solutions that are perhaps less suited to the C4 model include embedded systems/firmware, and solutions that rely on heavy customization rather than bespoke development (e.g. SAP and Salesforce). Even with these solutions, you still may find the System Context and Container diagrams useful.
Does the C4 model scale?
The example diagrams conveniently consist of a small number of boxes and arrows, but you might be asking how the C4 model can be used with real-world software systems, where you have 600 components rather than 6. The answer is that the tooling you choose can either help or hinder you.
Even with a relatively small software system, it’s tempting to try and include the entire story on a single diagram. For example, if you have a web application, it seems logical to create a single component diagram that shows all the components that make up that web application. Unless your software system really is that small, you’re likely to run out of room on the diagram canvas or find it difficult to discover a layout that isn’t cluttered by a myriad of overlapping lines. Using a larger diagram canvas can sometimes help, but large diagrams are usually hard to interpret and comprehend because the cognitive load is too high. And if nobody understands the diagram, nobody is going to look at it.
Instead, don’t be afraid to split that single complex diagram into a larger number of simpler diagrams, each with a specific focus around a business area, functional area, functional grouping, bounded context, use case, user interaction, feature set, etc. The key is to ensure that each of the separate diagrams tells a different part of the same overall story, at the same level of abstraction.
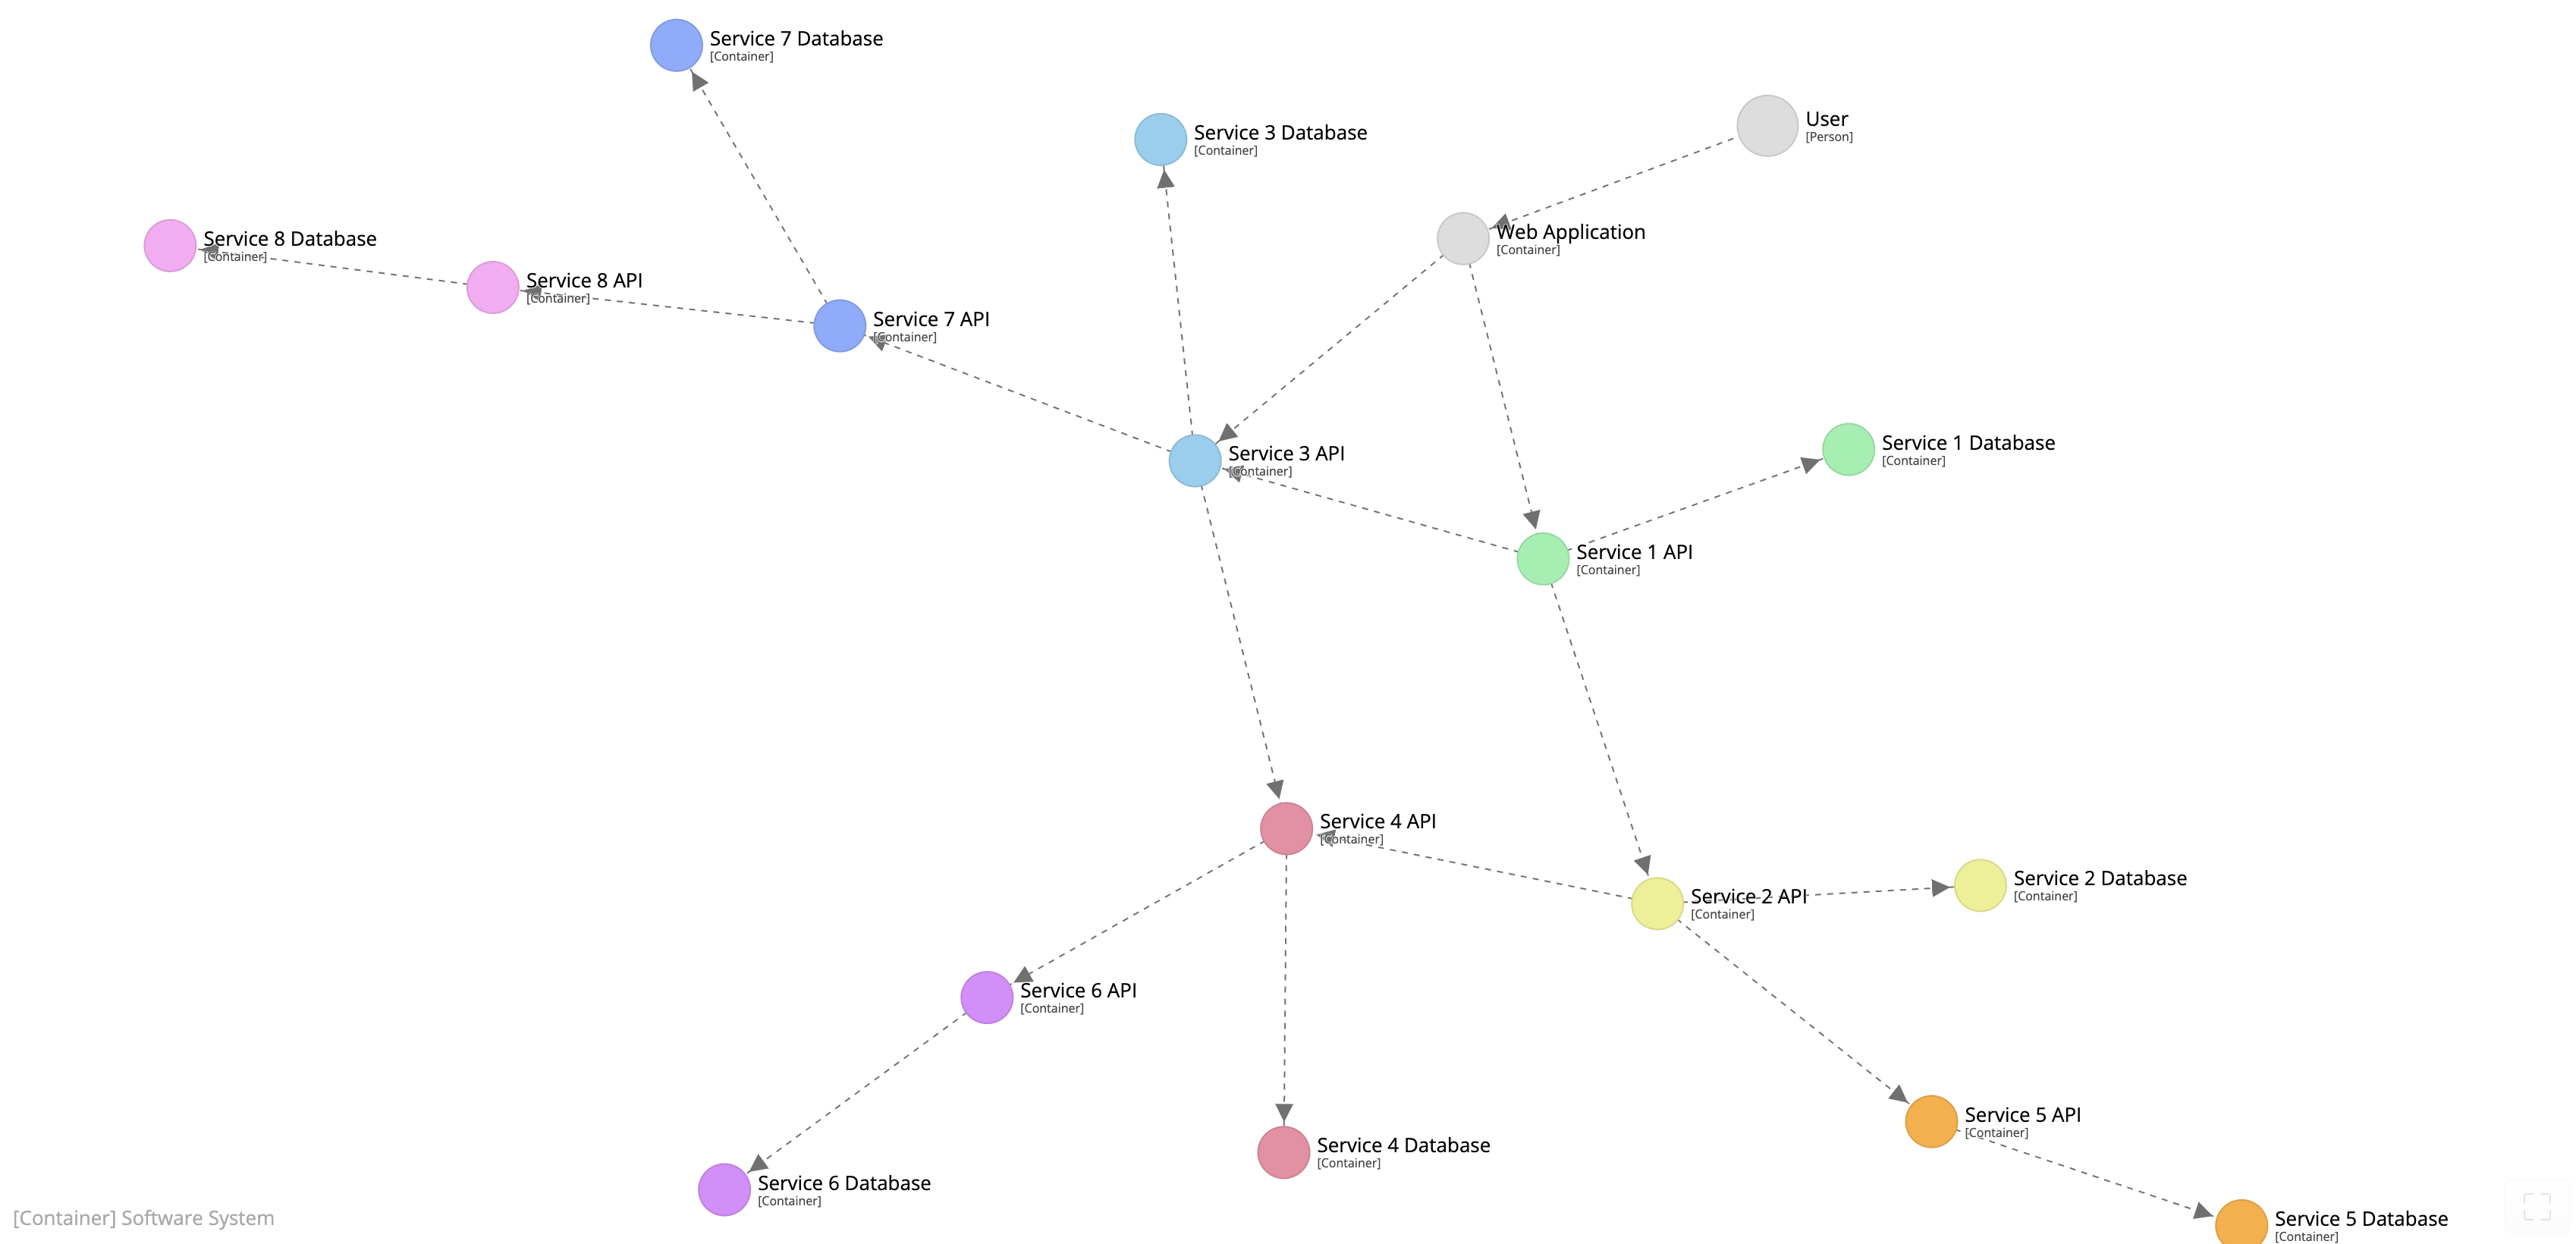
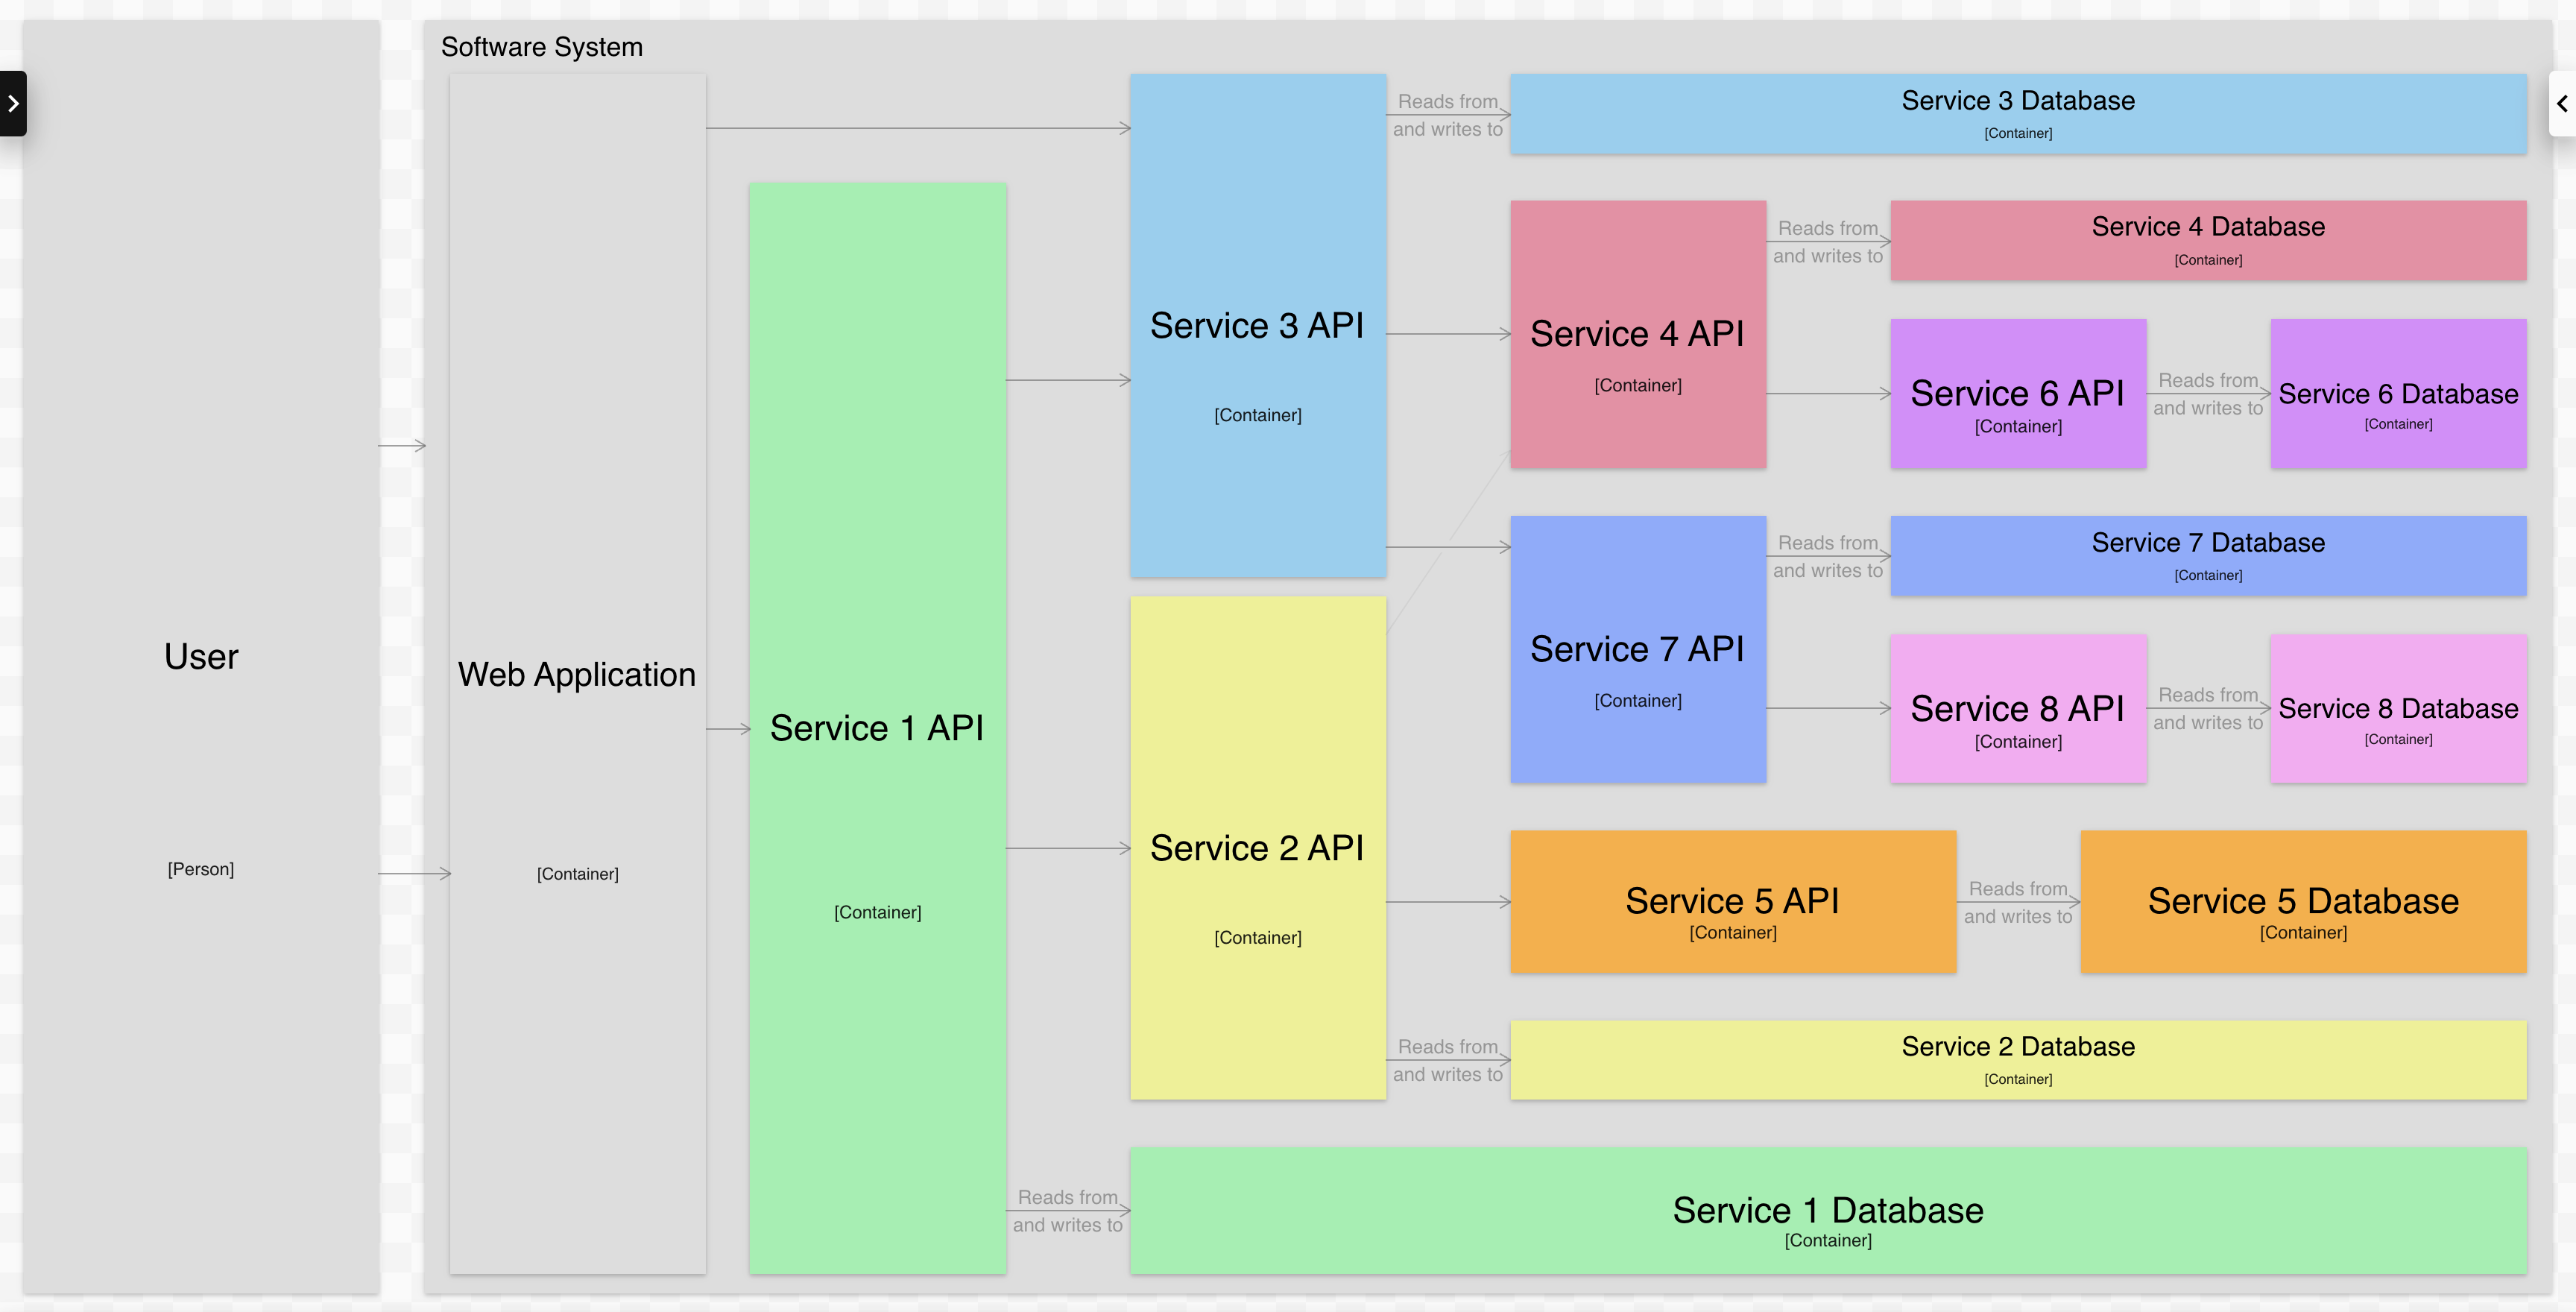
Here’s an example of a container diagram showing a software system comprised of a number of microservices:
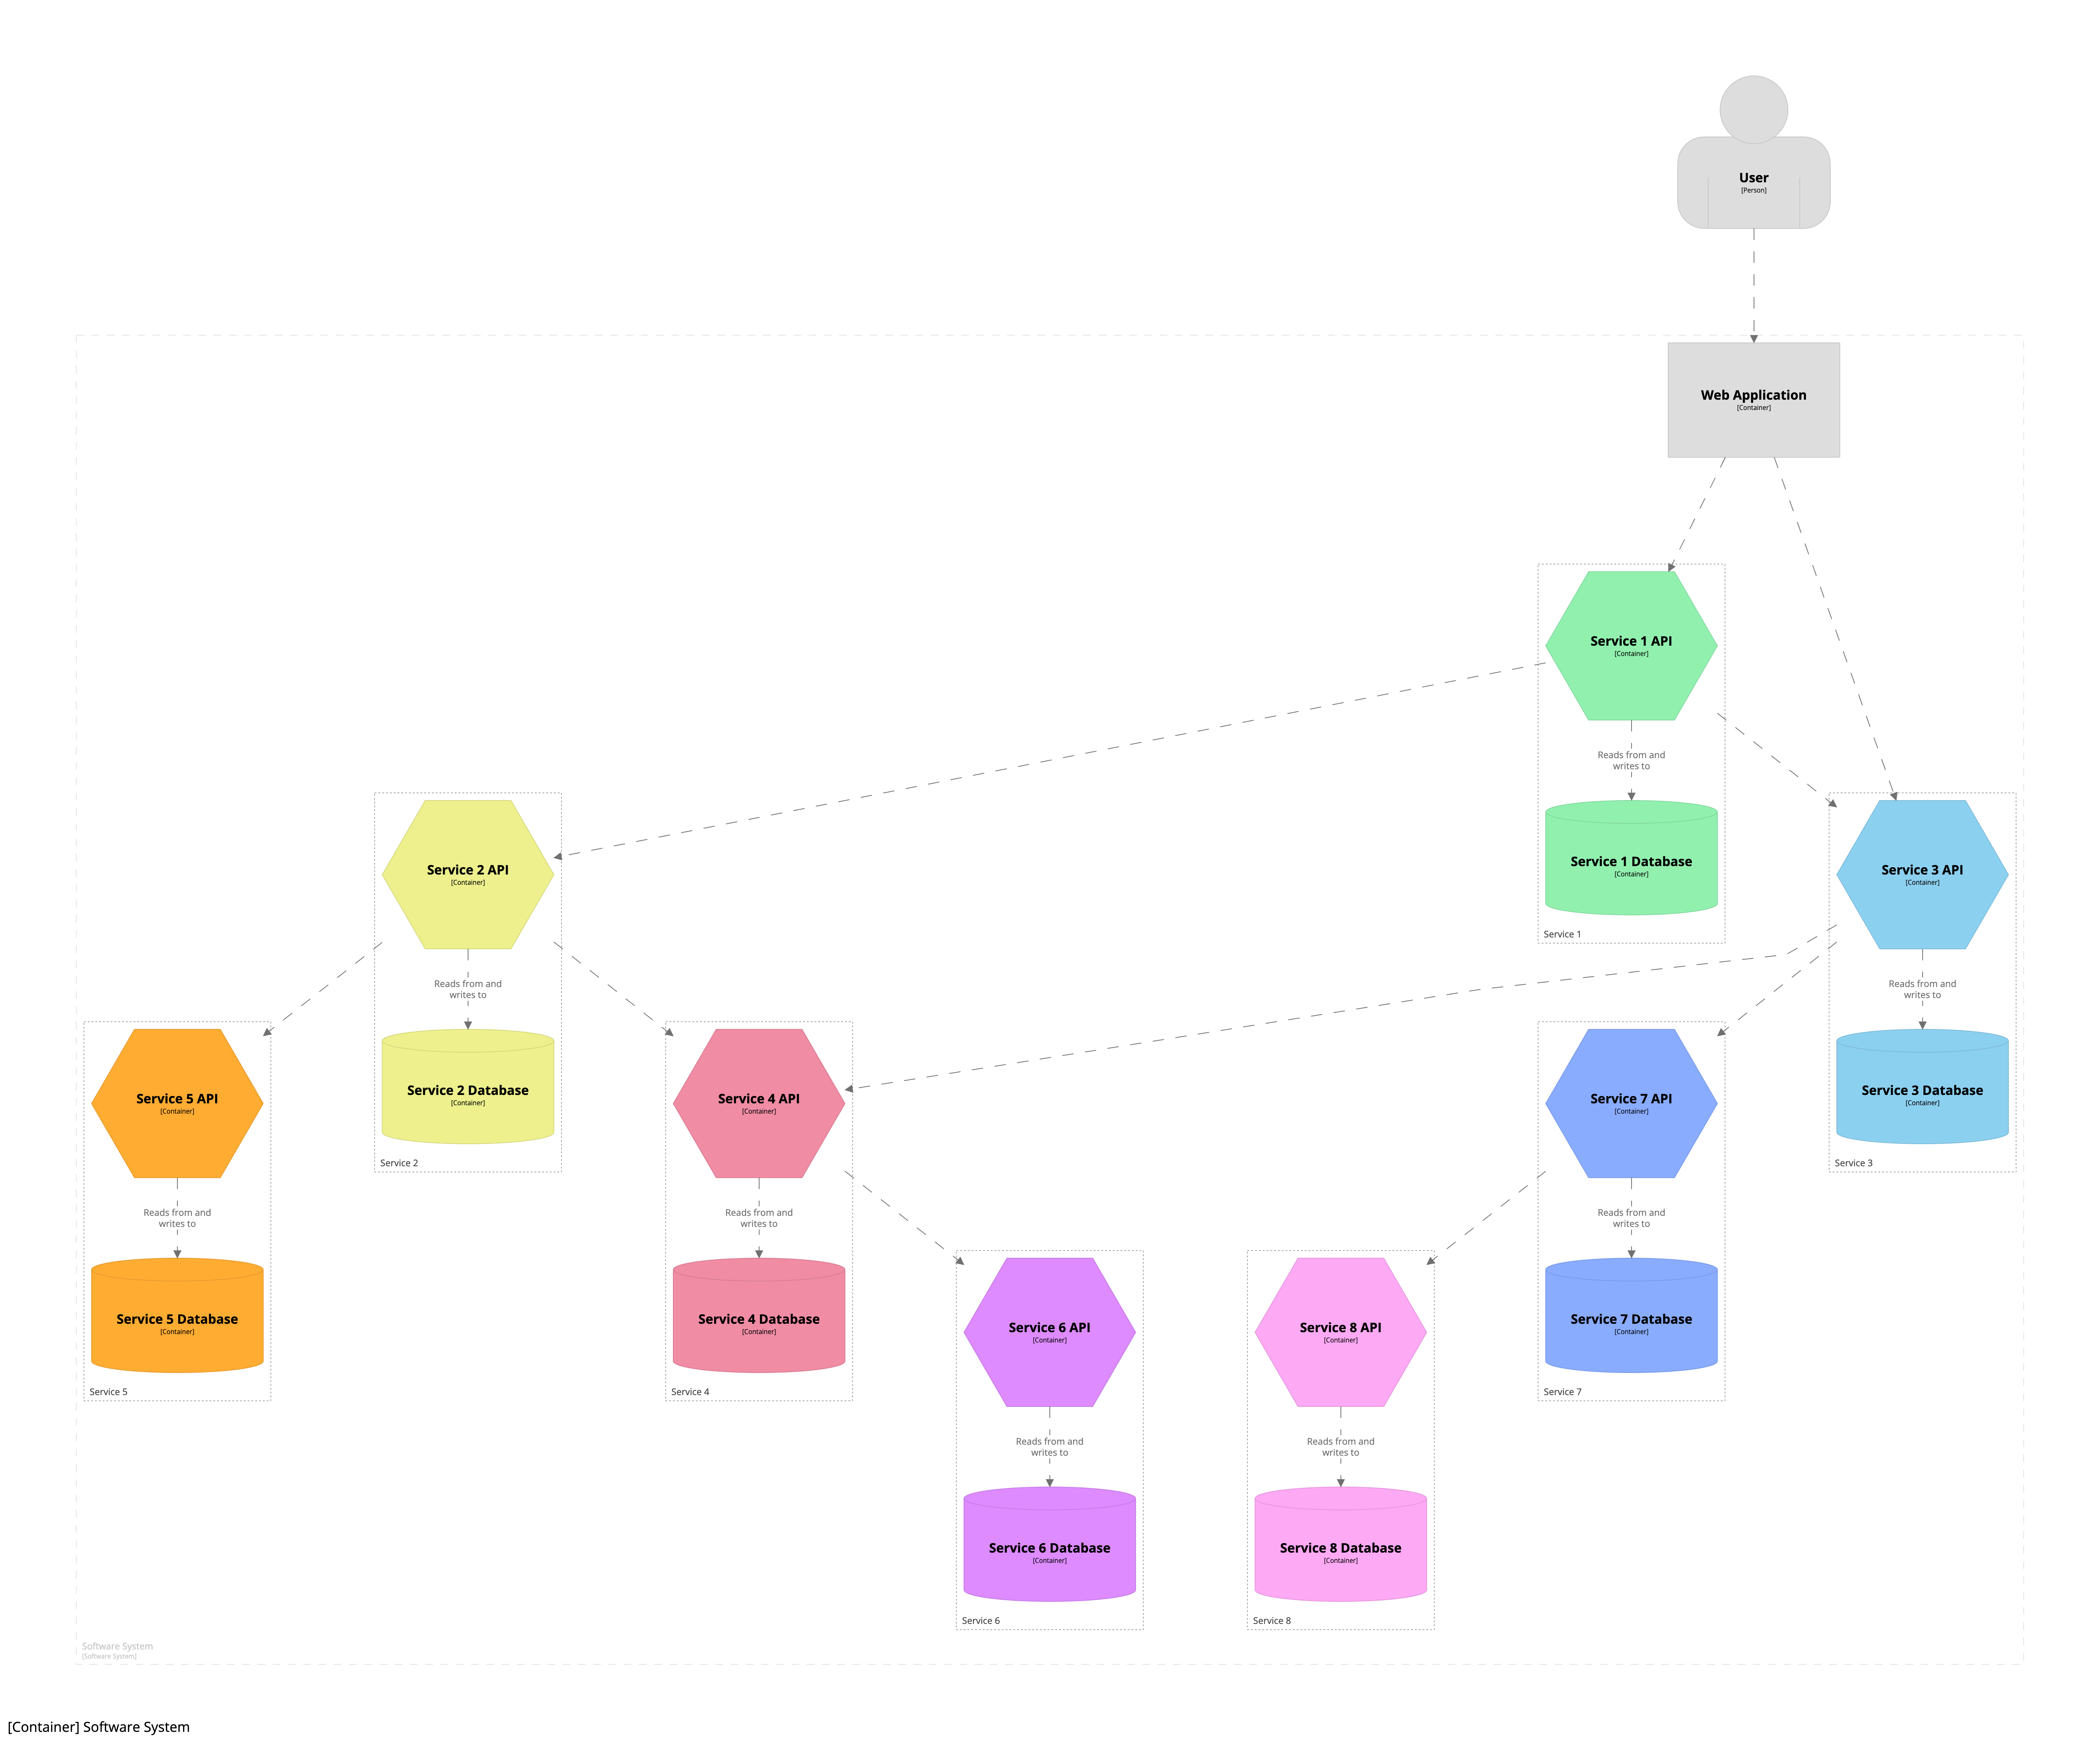
This diagram works at the moment, but will quickly become cluttered as we add more services. As an alternative approach, rather than creating a single diagram showing 8 services, we could create 8 diagrams that each focus on a single service, showing the nearest afferent (inbound) and efferent (outbound) dependencies:
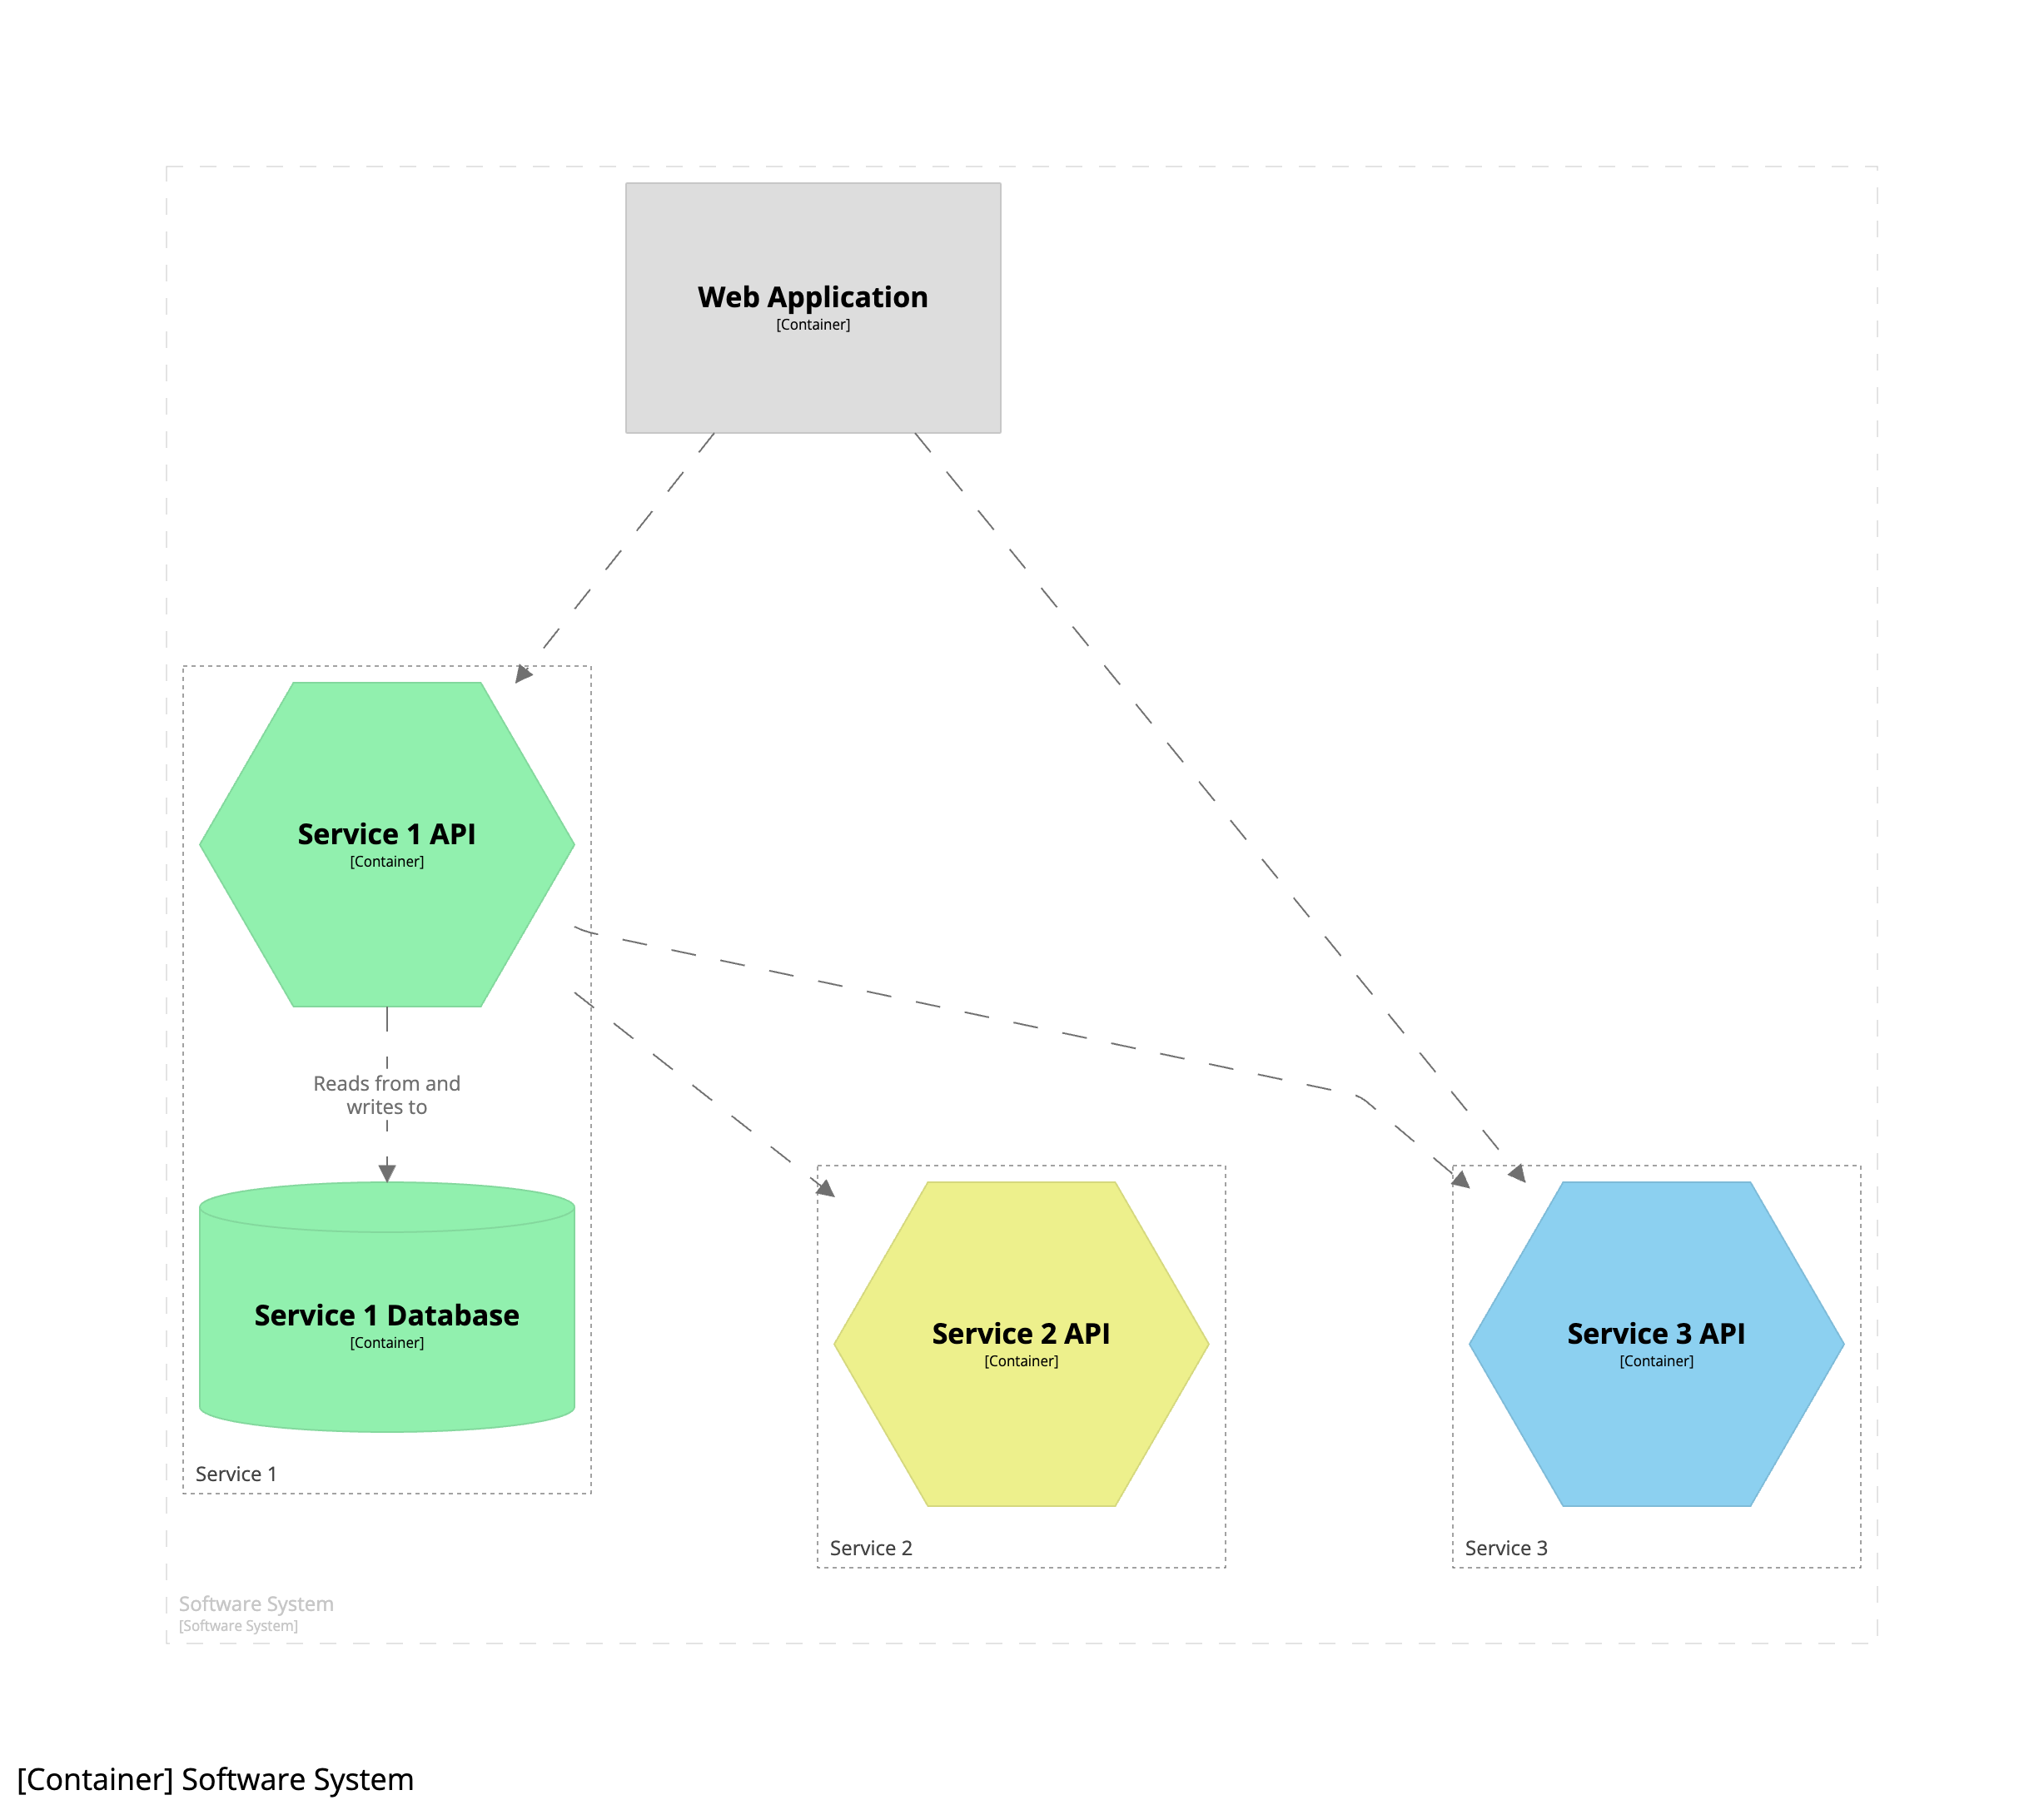 | 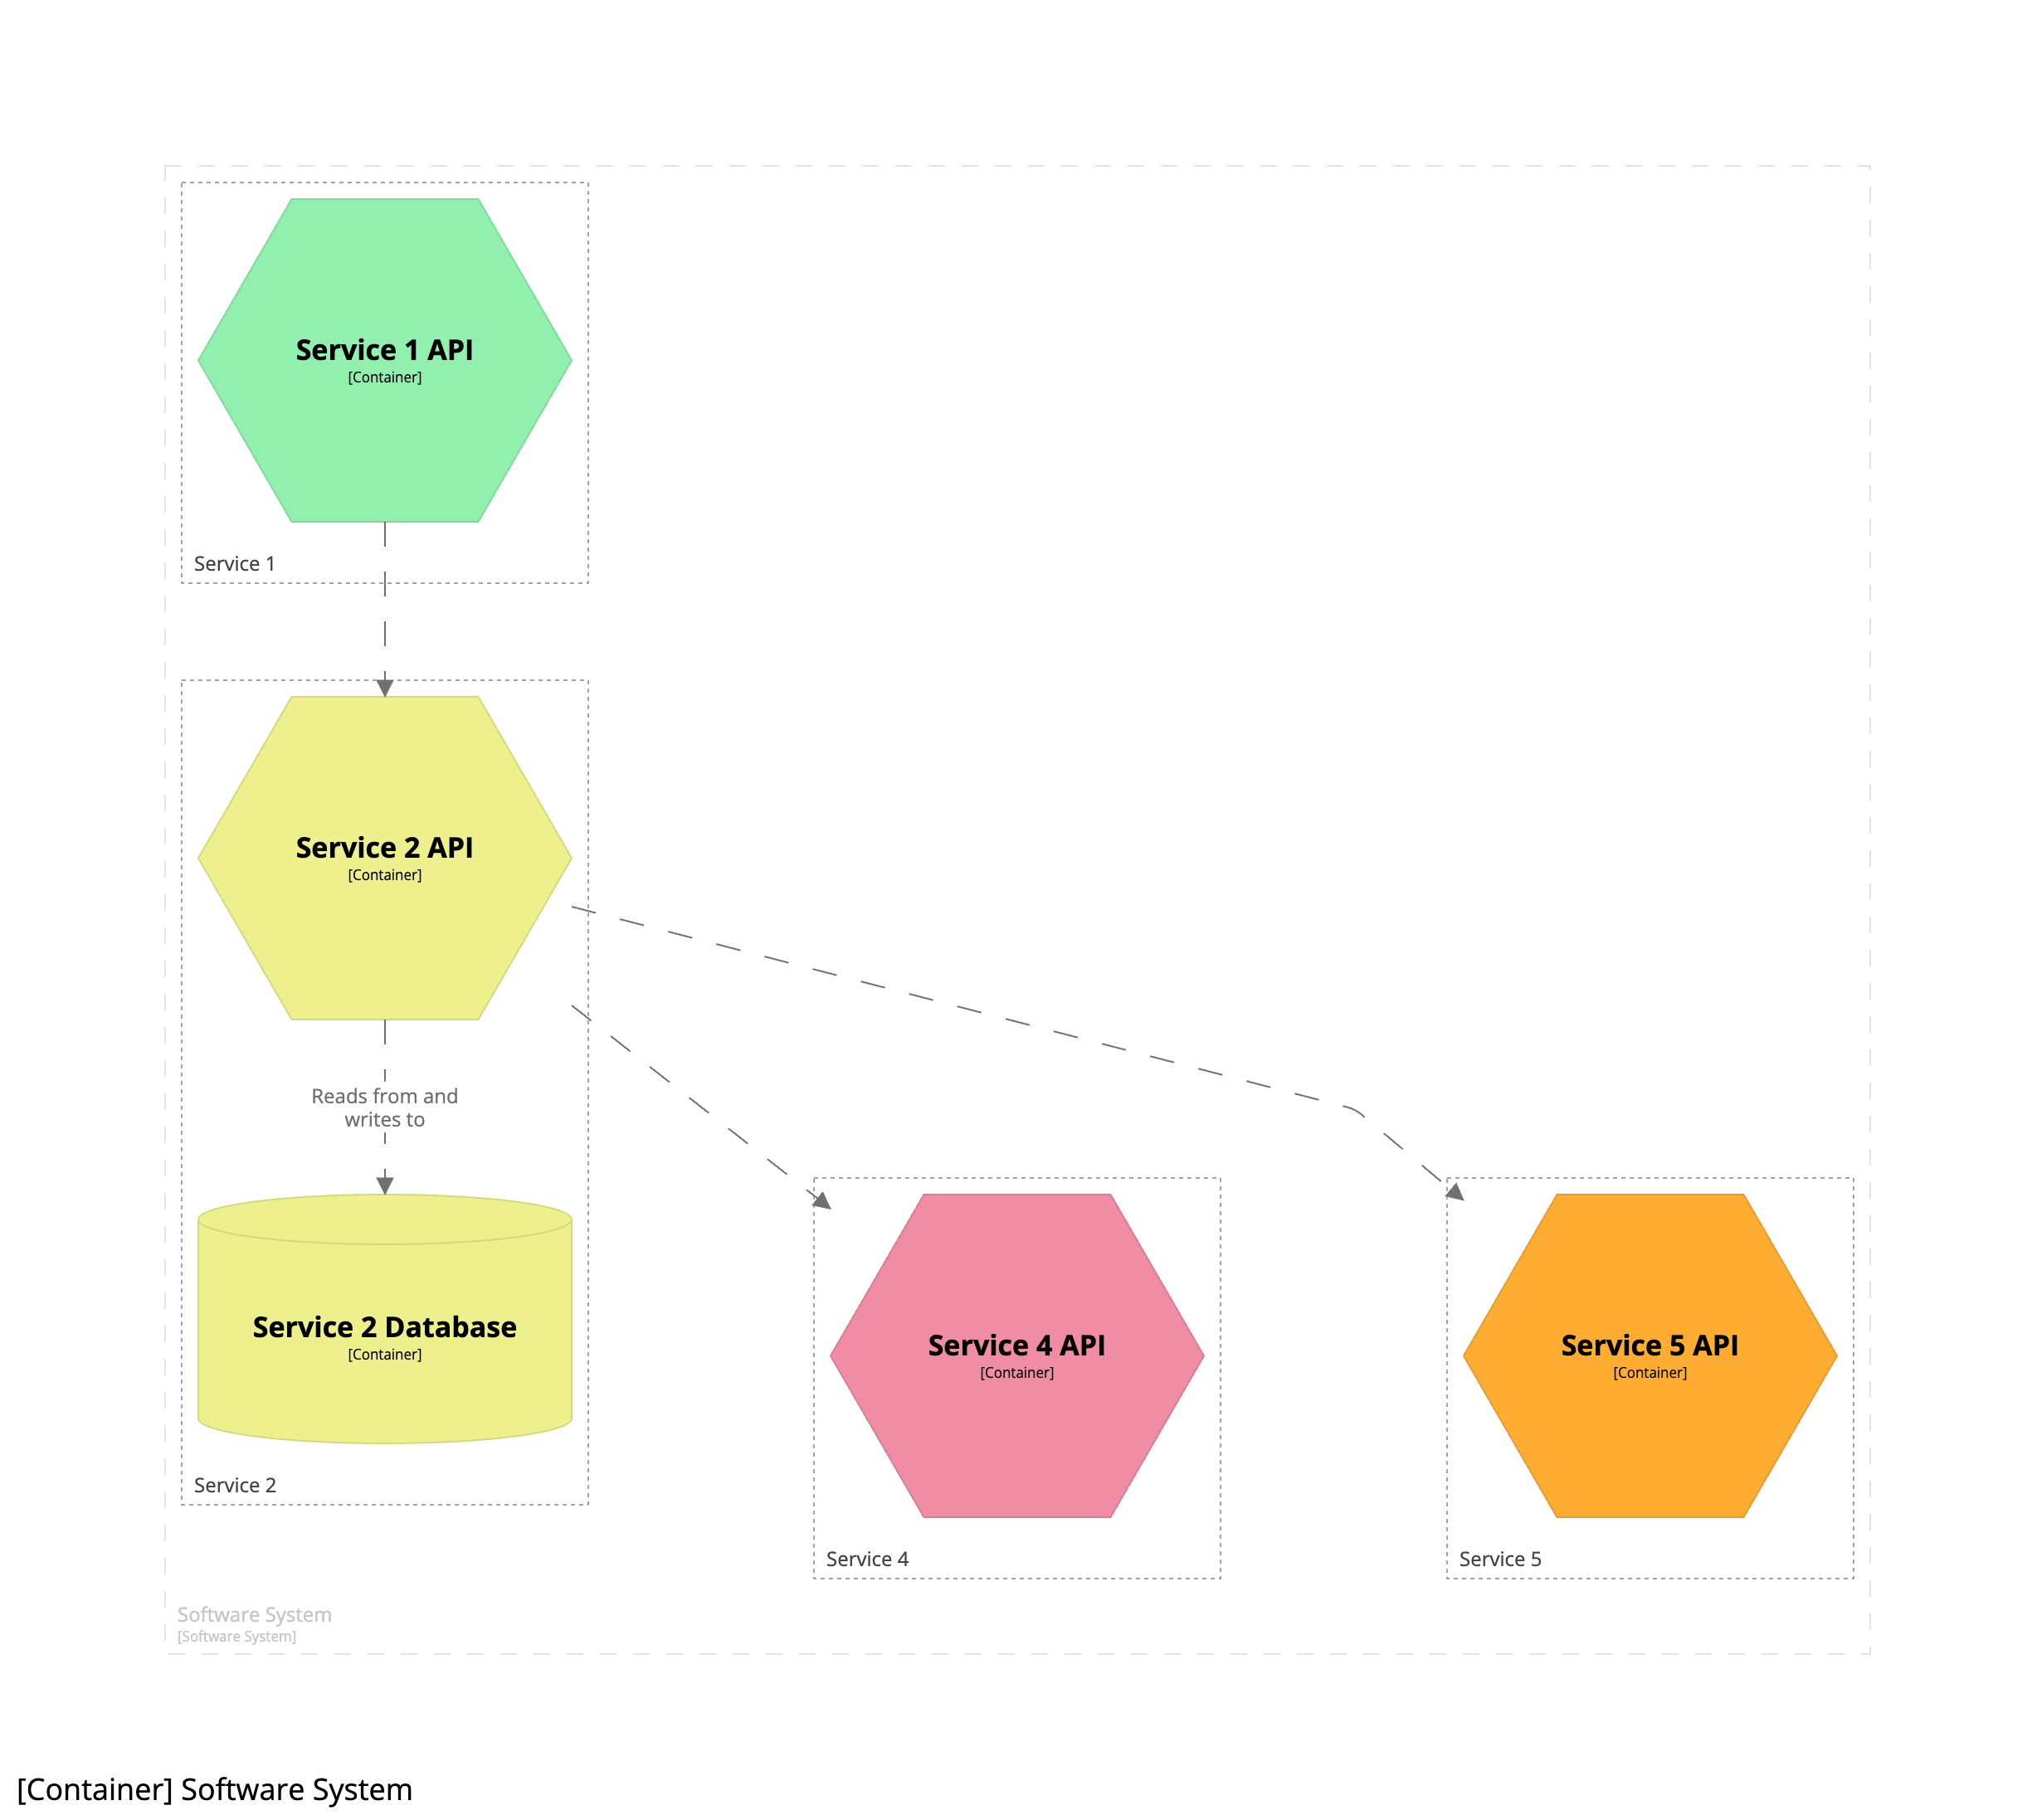 |  |
| Service 1 | Service 2 | Service 3 |
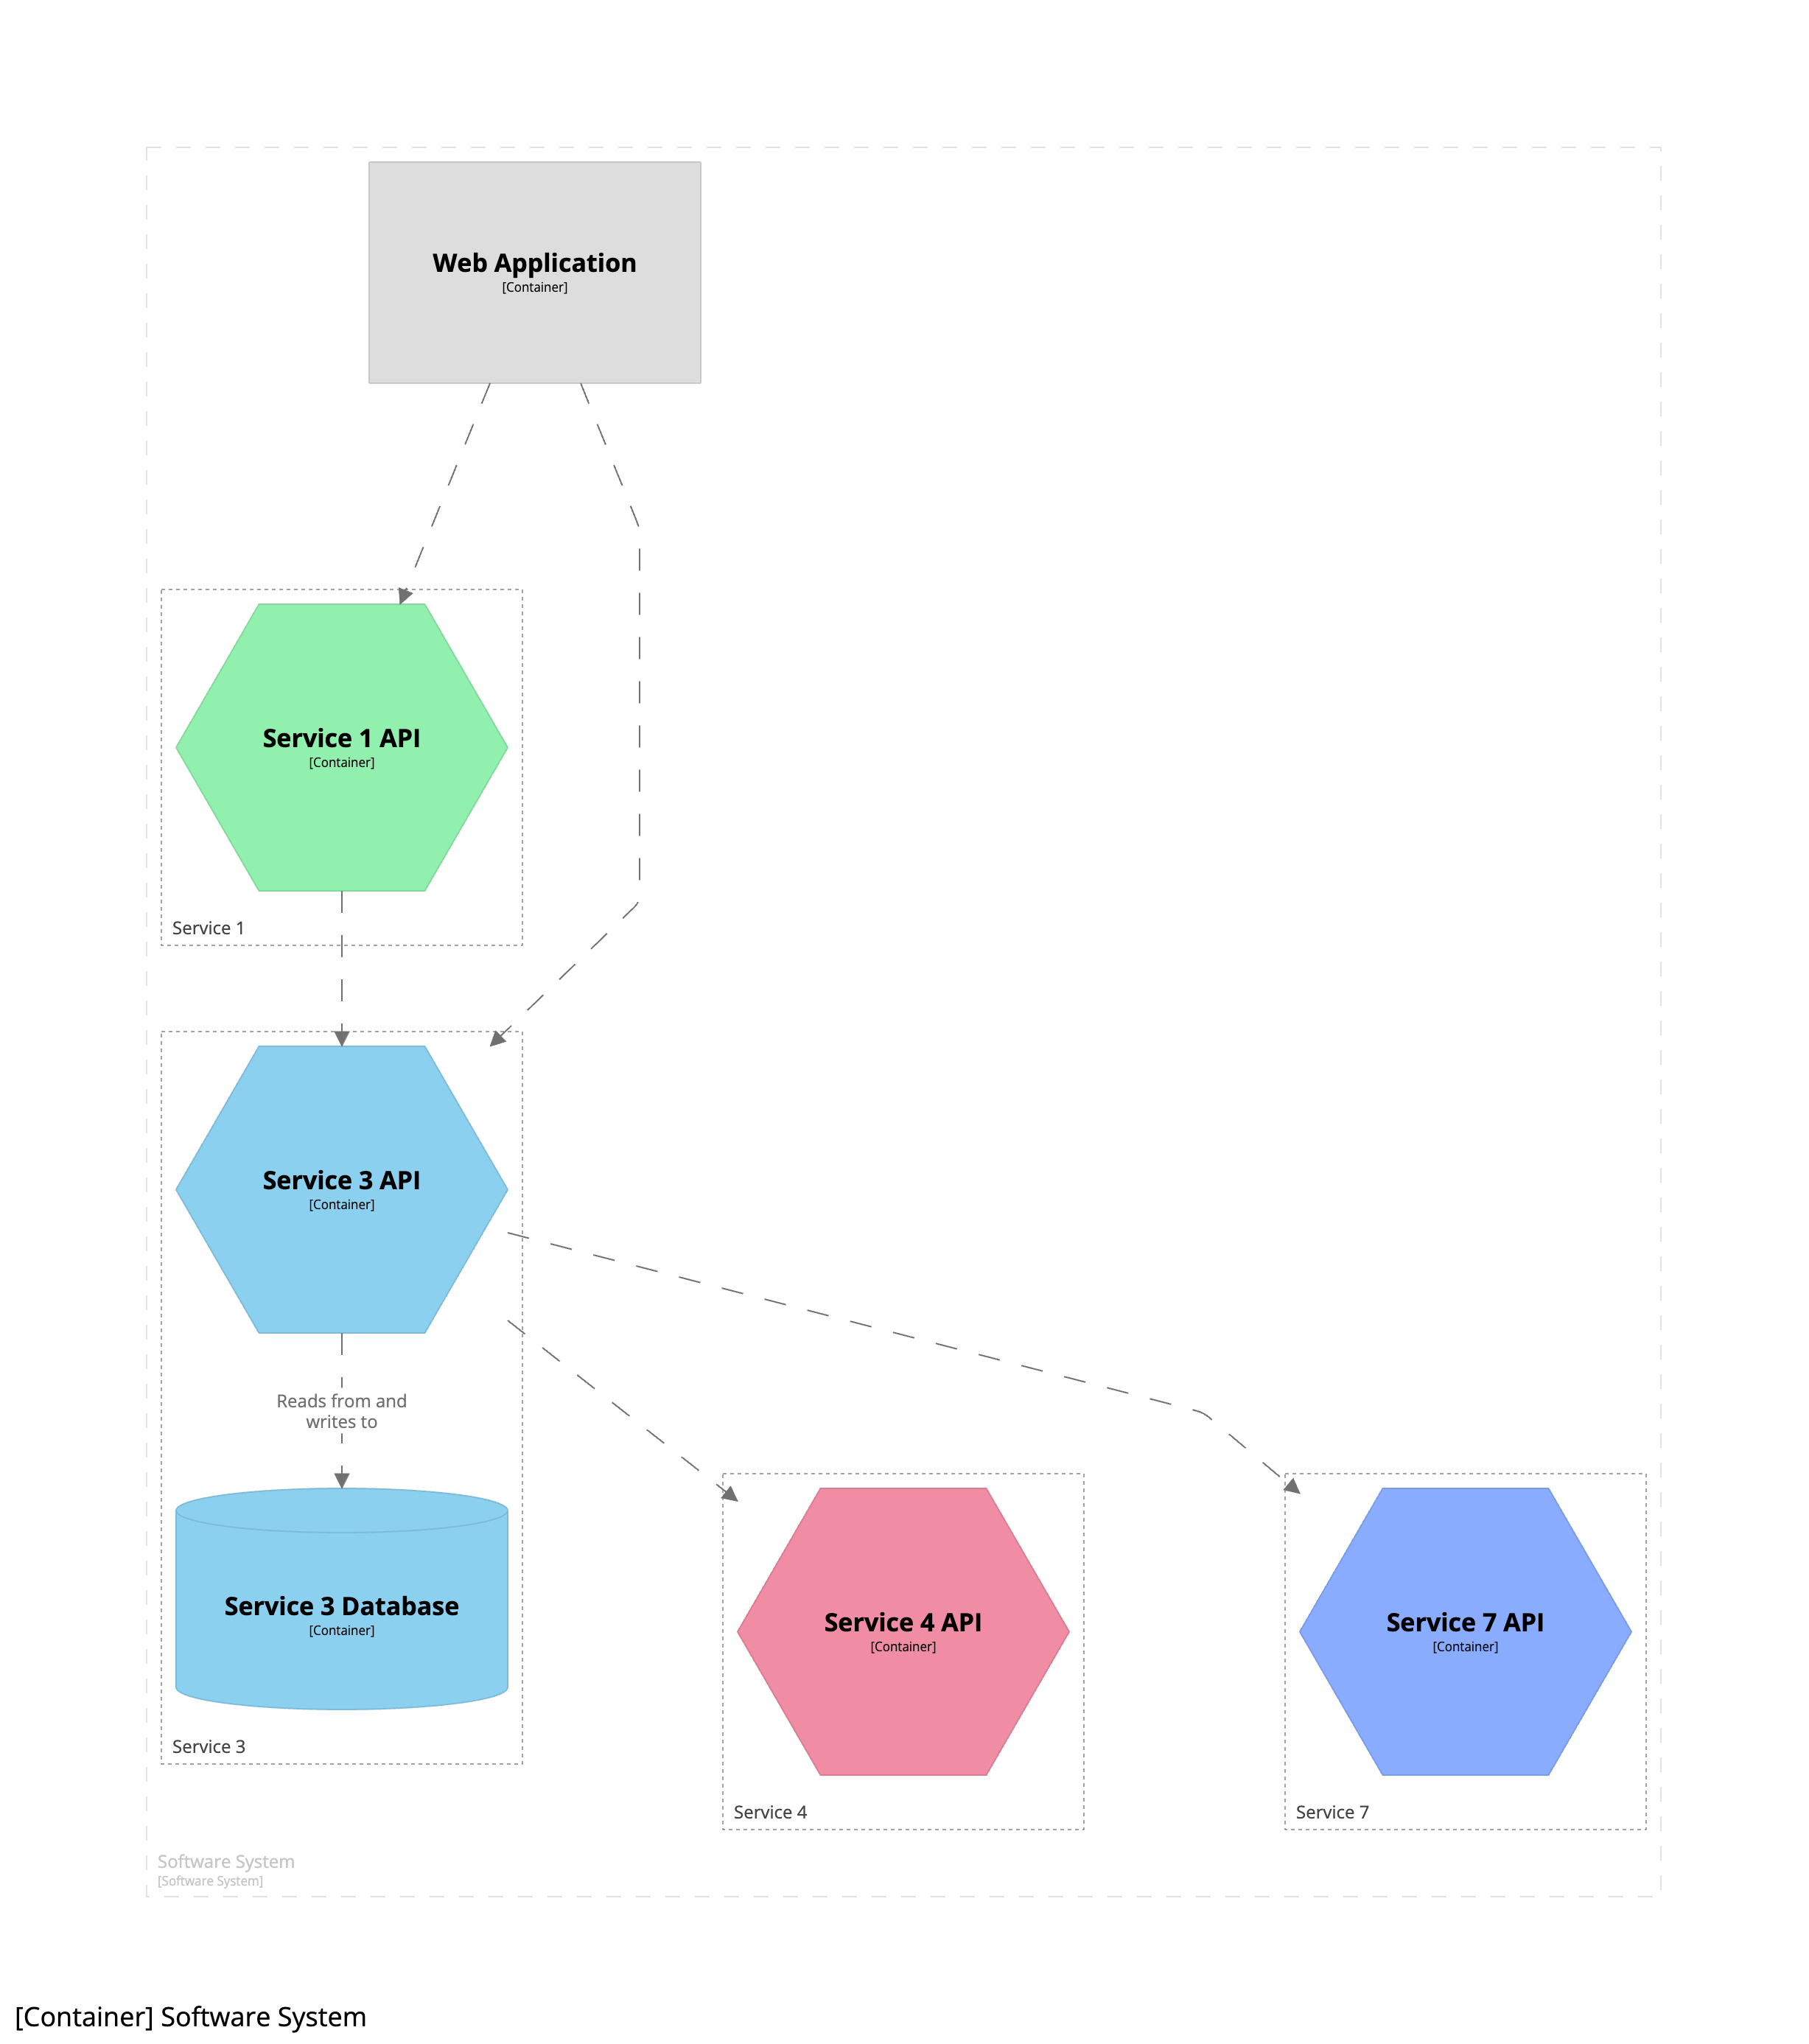
This is difficult to do with a diagramming tool, but trivial with a modelling tool - see Diagramming vs modelling for more details. The trade-off here is that we lose the “big picture”. So another option is to create some alternative visualisations that are not as verbose as the traditional “boxes and lines” diagrams. Again, this is relatively straightforward when you use a modelling tool, and think about the software architecture model as being a data structure that you can visualise in different ways.
 |  |