Queues and topics
Imagine that we have a service-based architecture, where a number of services (A and B) produce messages, and a number of other services (C & D) consume messages. A common way to diagram such an architecture is like this:
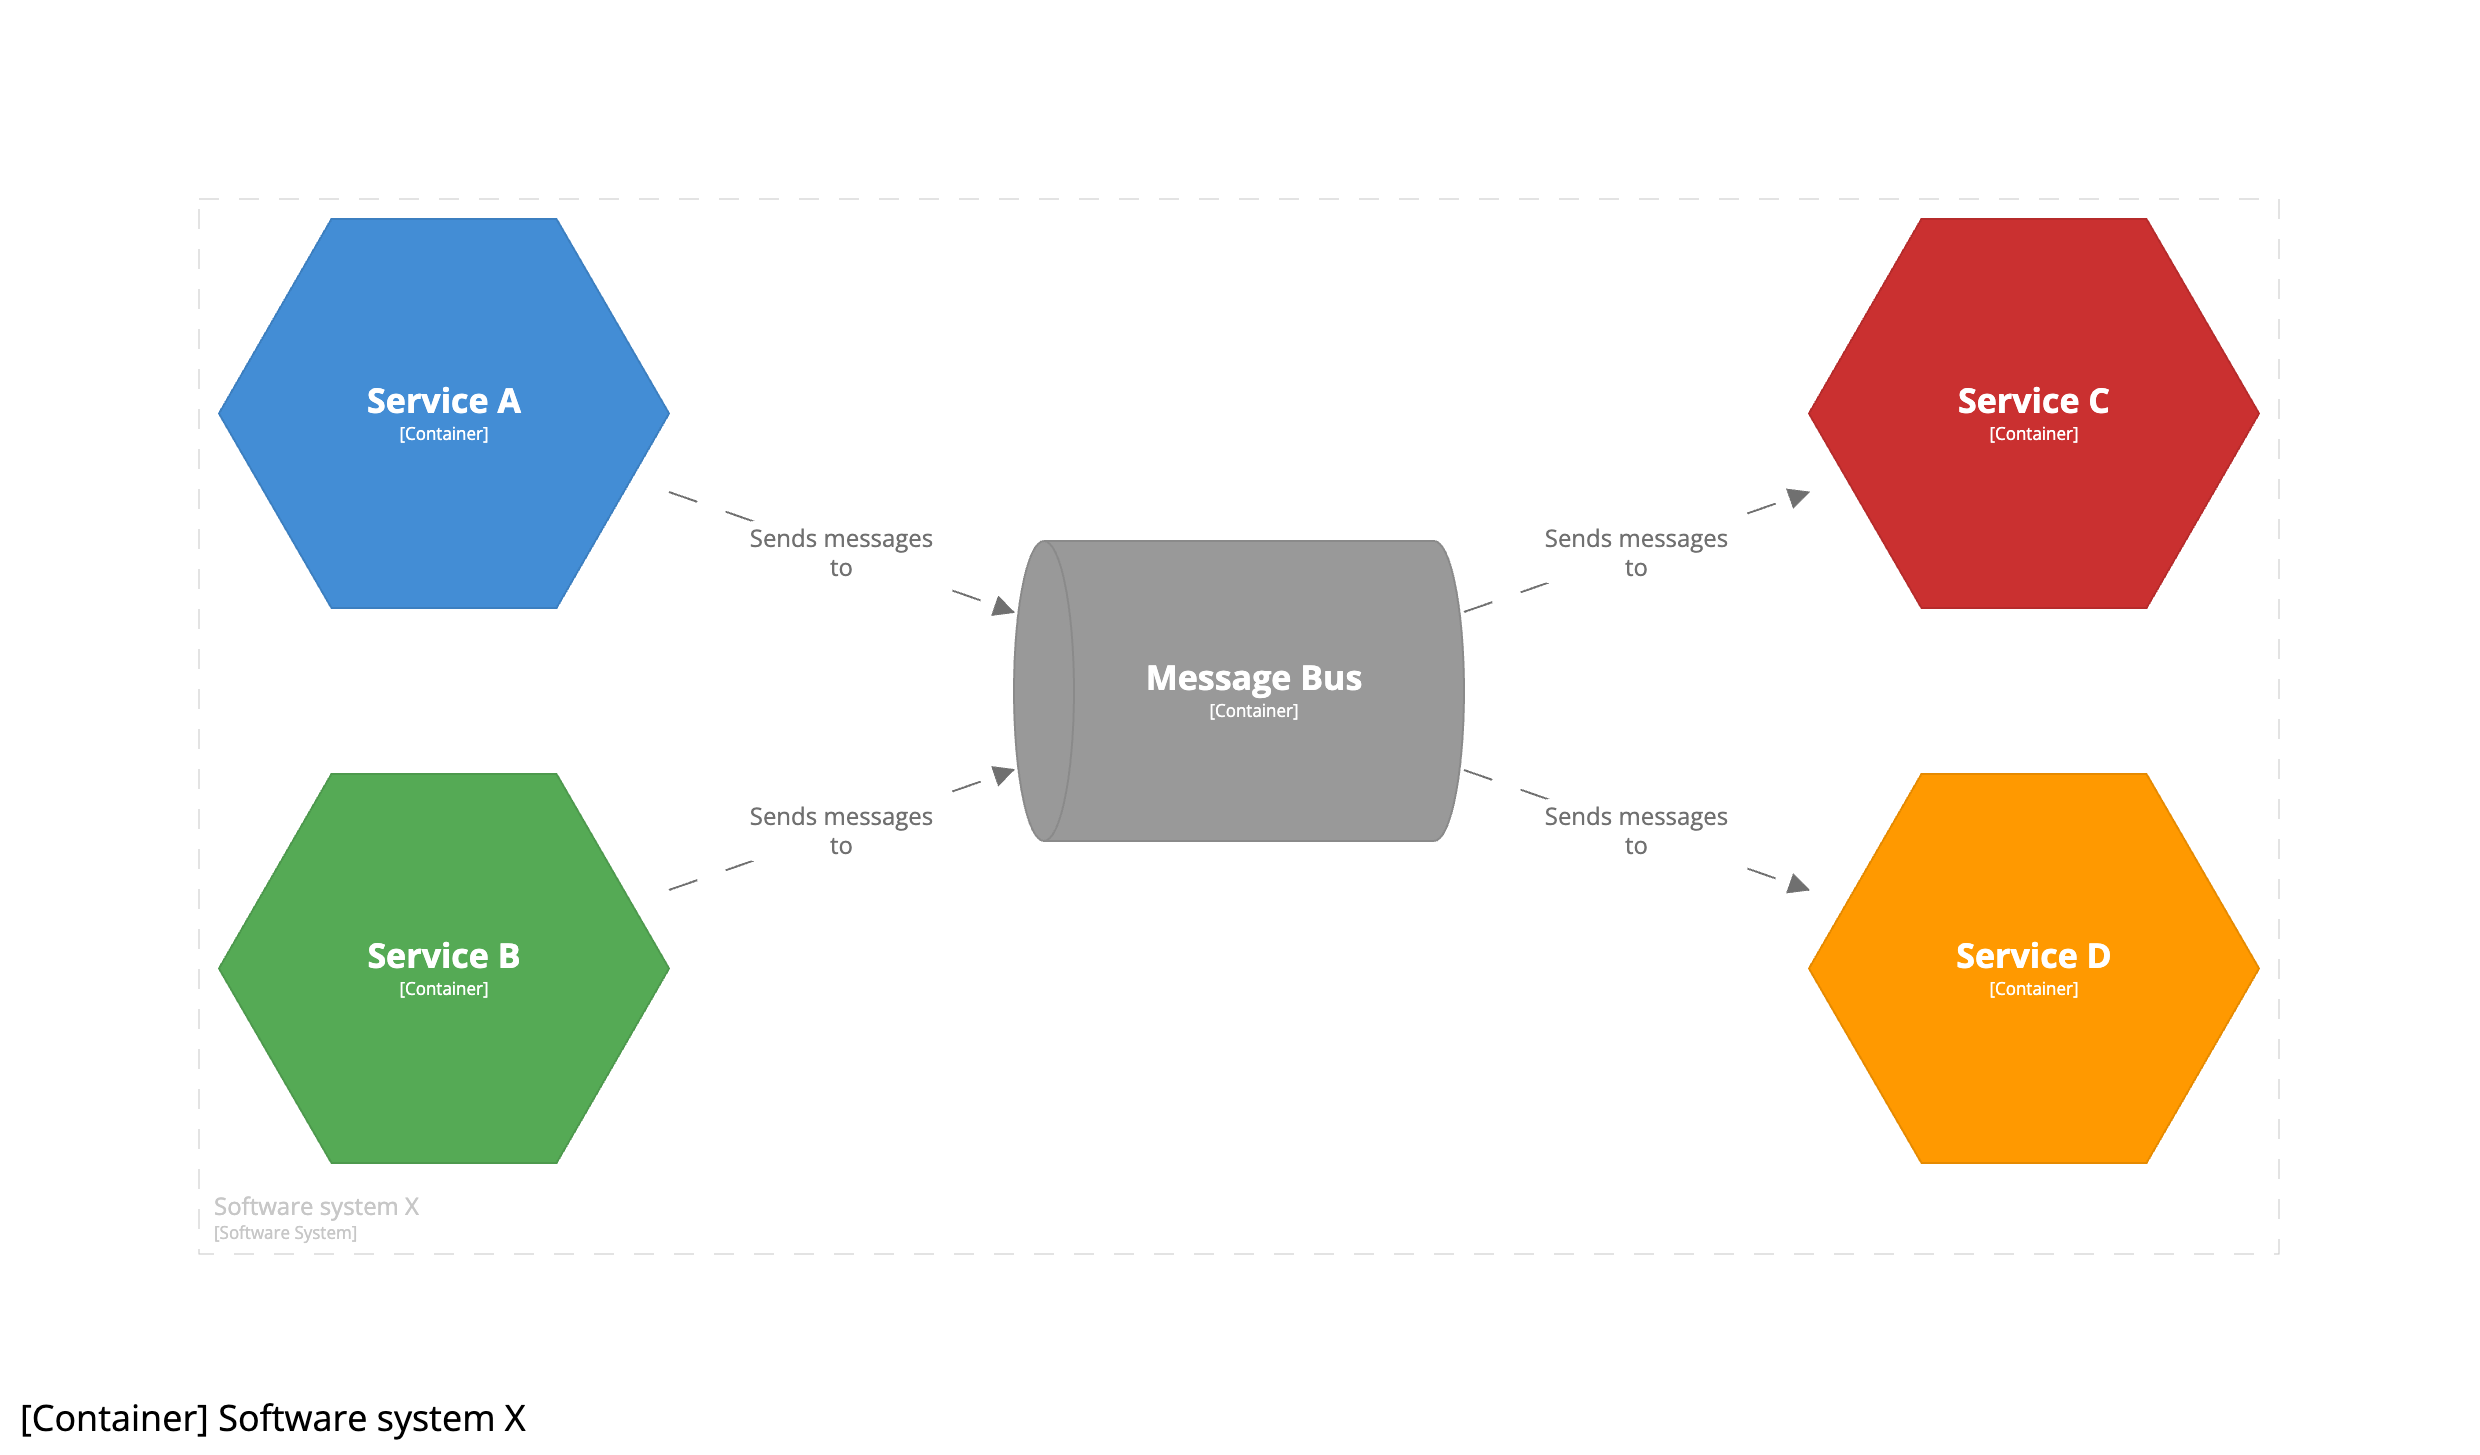
From some points of view, this diagram is a true and accurate representation of the architecture. Services A and B are sending messages to an intermediary, which is forwarding those messages on to services C and D. The problem is that the “hub and spoke” nature of this diagram tends to obscure the real story, where a degree of coupling may exist between the message producers and consumers.
Point-to-point
The problem here is being caused by us representing the message bus as a C4 container, which arguably isn’t correct. A better approach is to think about each separate queue and topic as being a “data store”. A message queue is essentially a data store - it’s a bucket for storing data (messages), with producers adding data, and consumers taking it away. The implication here is that the queues and topics are C4 containers, rather than the message bus itself.
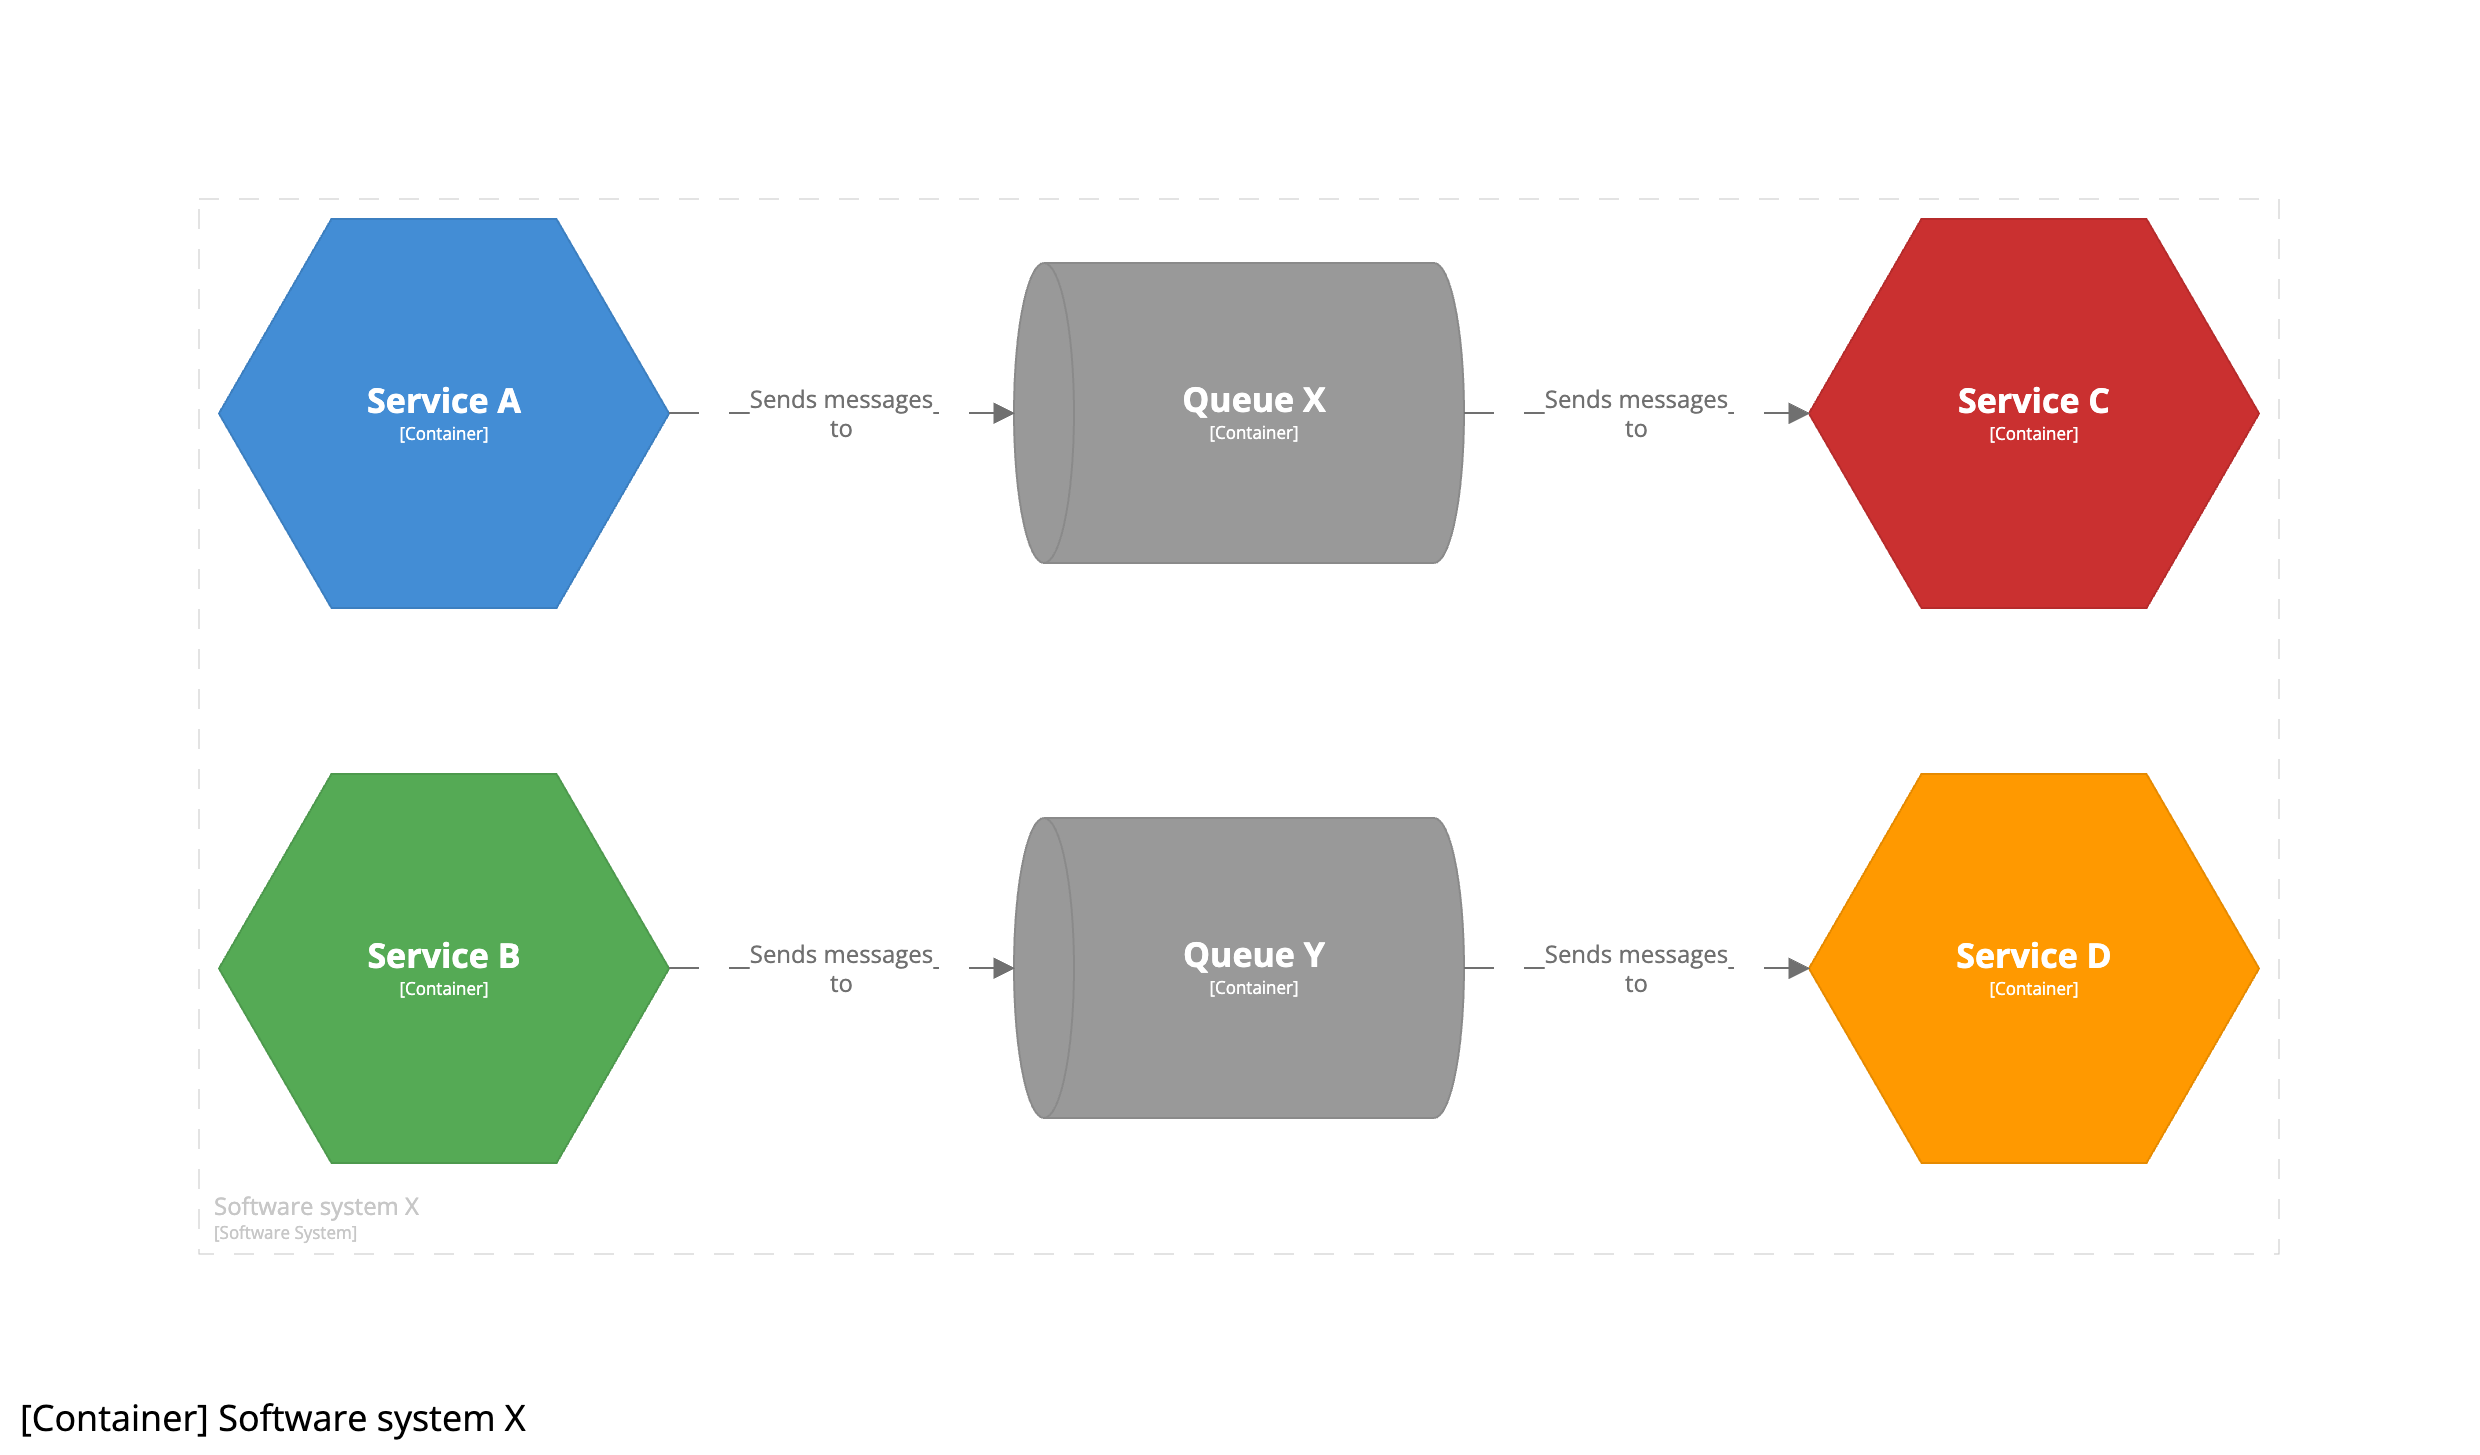
In this example, we can clearly see there’s a coupling between services A and C via a queue named X, and there’s a similar point-to-point coupling between services B and D via a queue named Y.
Modelling queues and topics as C4 containers also provides a way to think about them independently of their deployment topology. At development time, you might have all queues and topics running on a single instance of a message bus to save resources on your laptop. The live deployment topology might see individual queues and topics deployed to separate message buses, brokers, or clusters for performance, scalability, or security reasons.
If you genuinely have a point-to-point coupling via a queue, you could further simplify this diagram by omitting the queues, and moving the queue names to the arrows instead.
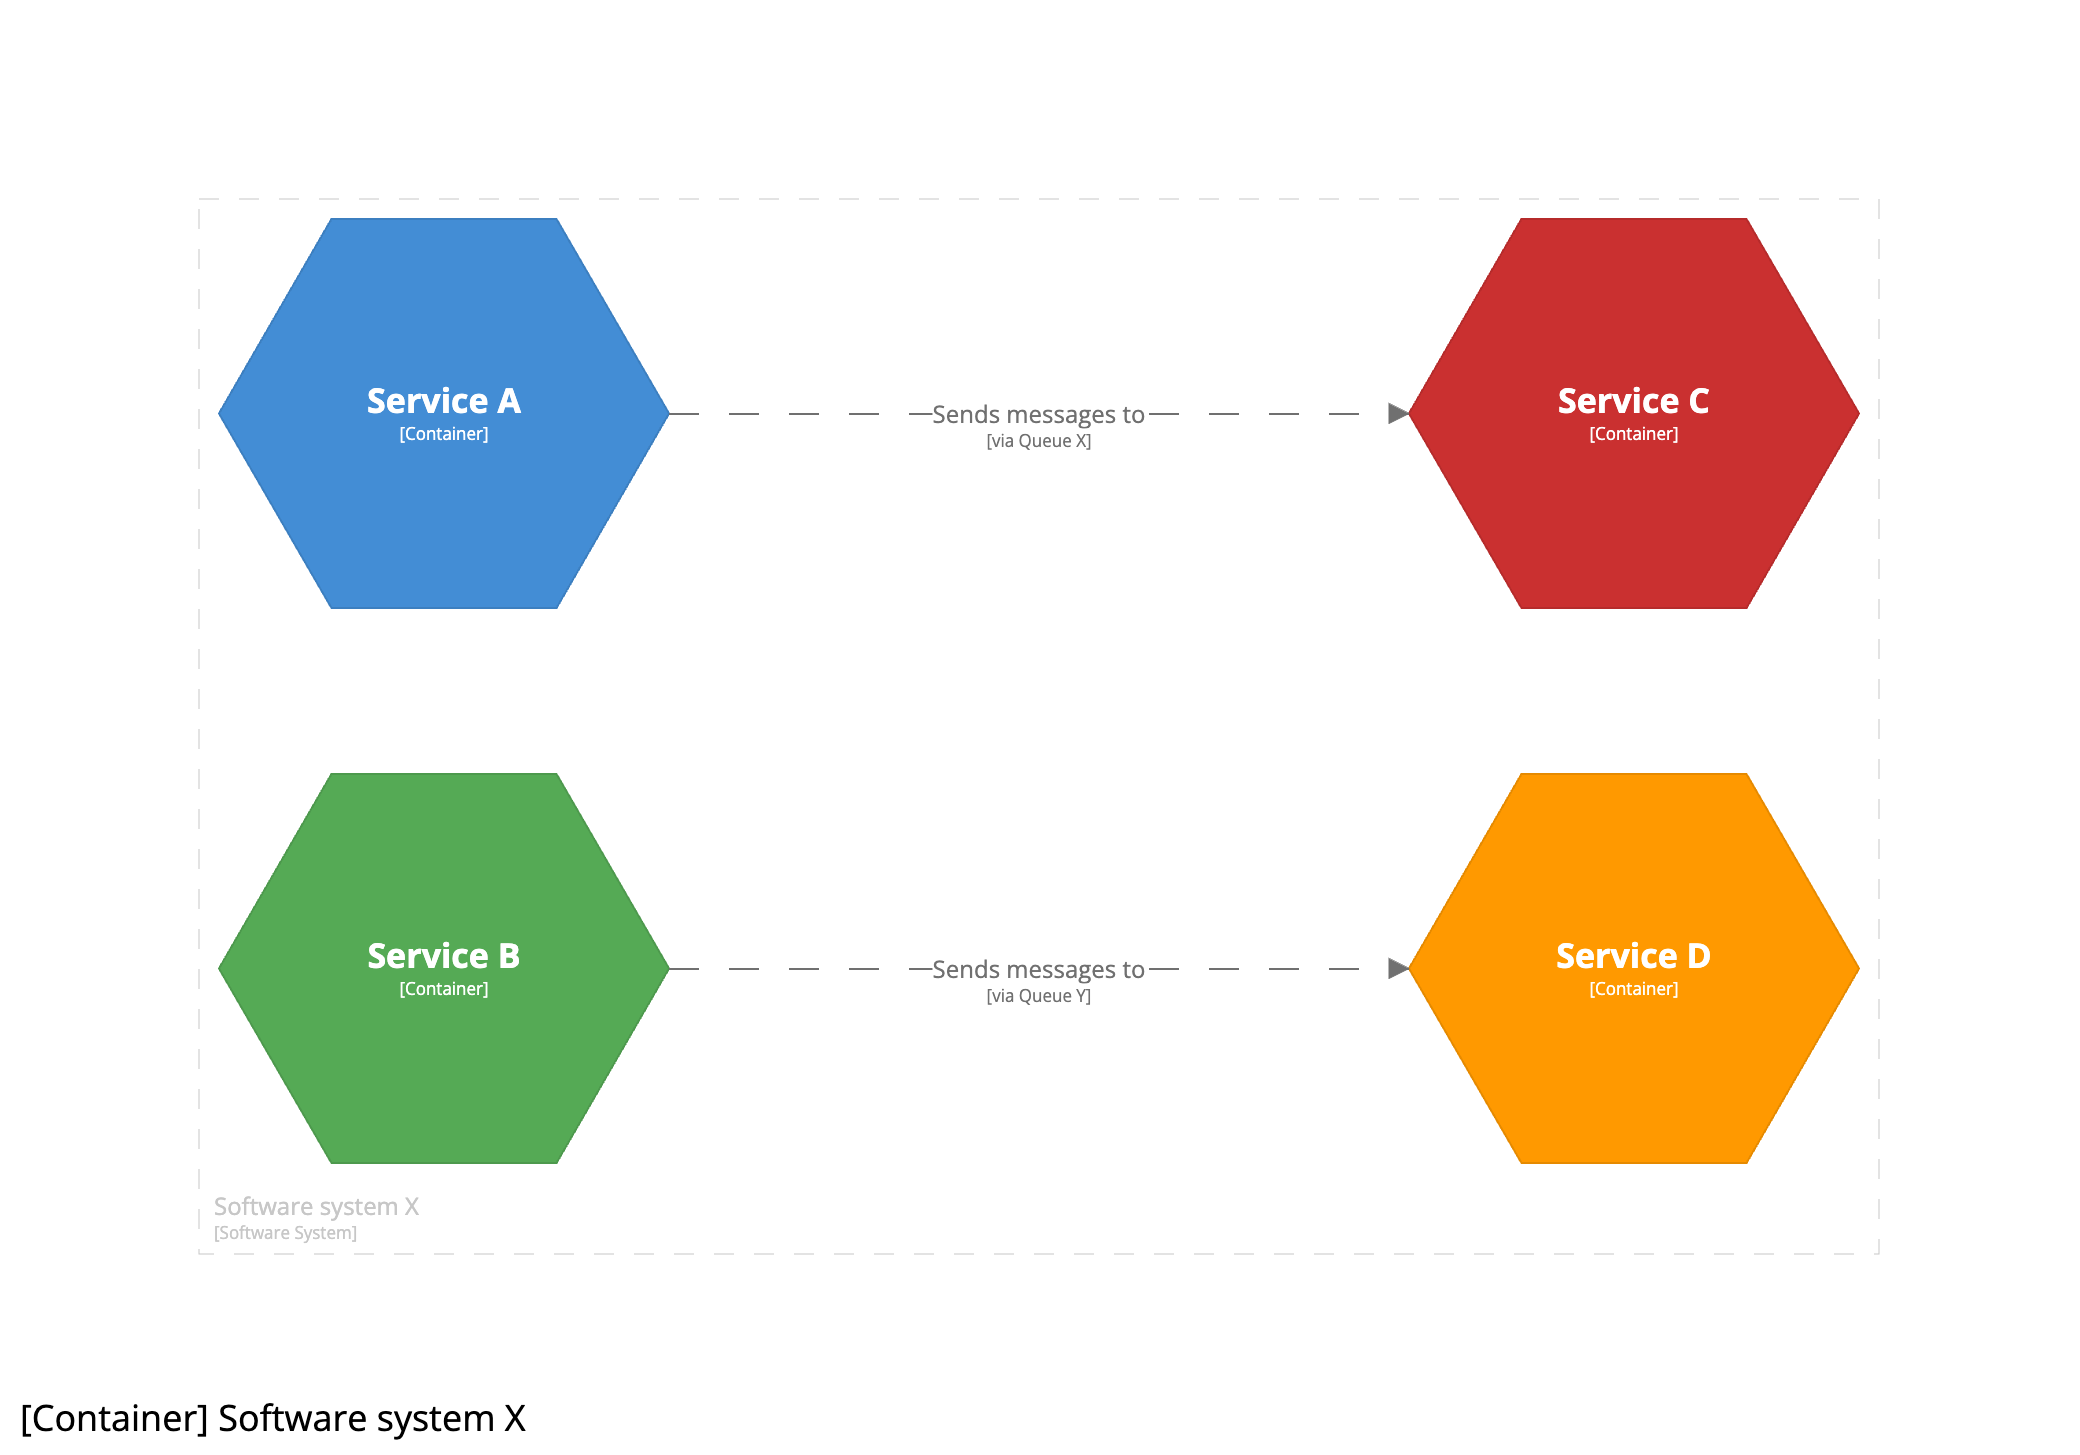
The result is a visually simpler and less cluttered diagram, but the queues are no longer as explicitly evident on the diagram. Since the C4 model is notation independent, you could additionally use a different line style (solid vs dashed) or colour to highlight message-based relationships vs API calls, for example. Neither version of the diagrams is “better” than the other, they are just telling the same story in a different way. It’s all trade-offs.
Pub/sub
You’ll notice that all diagrams have shown messages flowing from the left of the diagram to the right, with the arrows labelled as “Sends messages to”. Although this works well, particularly for point-to-point and queue-based architectures, you can also change the arrow directions to better highlight something more pub/sub or topic-based.
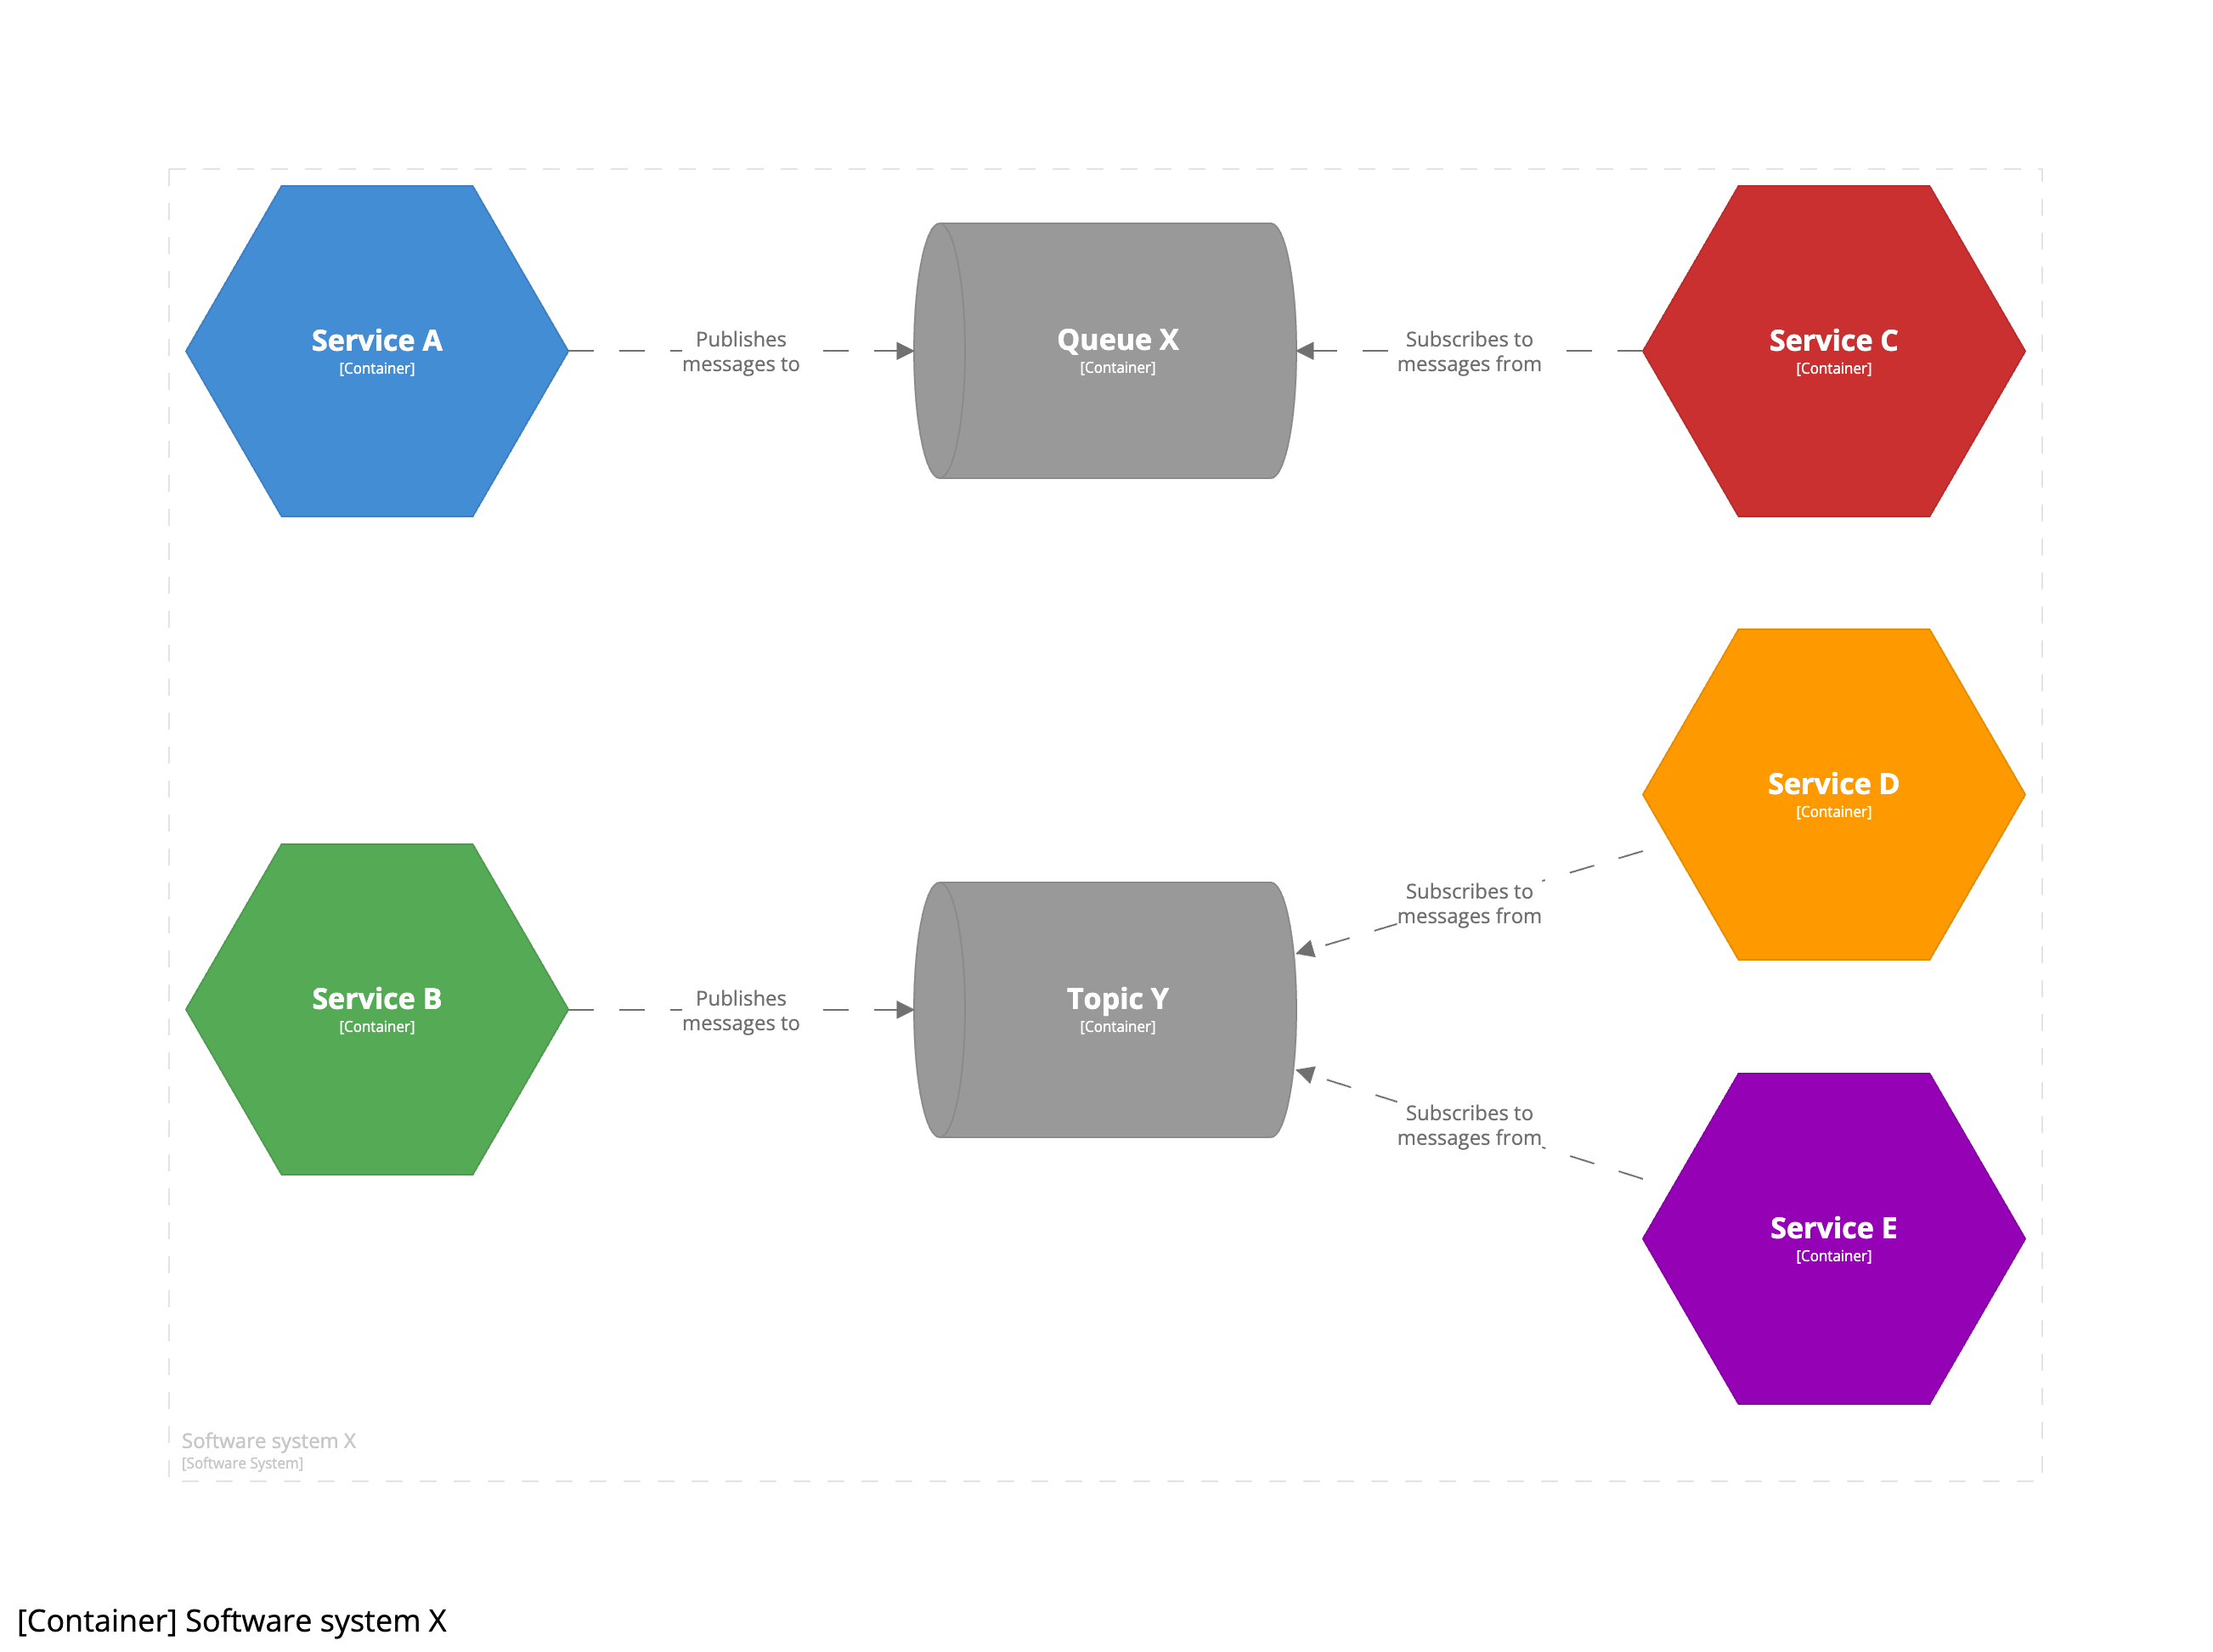
This version of the diagram better shows the roles of the message publishers and subscribers. Again, it’s just a different way of telling the same story.
Summary
There are a number of ways to diagram message-based architectures, with the latter two of the following being “correct”:
- Incorrect: Model the message bus as a C4 container.
- Correct: Explicitly model queues and topics as C4 containers.
- Correct: Implicitly model message-based interactions using a “via” notation on relationships.
Further considerations
The examples presented have assumed that a single software system is comprised from a number of services communicating via queues and topics. In other words, everything on the diagram sits “inside” the software system boundary, and is “owned” by that single software system.
If you’ve read the microservices recommendations and you’re modelling each service as a separate software system, you additionally need to consider who “owns” the queues and topics. If service A (a software system) has a point-to-point relationship with service B (also a software system) via a queue named X (a container) … who owns the container? Does service A own the definition of the message format and operation of the queue, or is it service B? Or perhaps it’s jointly owned, or owned by somebody else entirely. Ownership will impact the diagrams.